Tutorial 10: Power spectrum and frequency filters
Authors: Francois Tadel, Elizabeth Bock, John C Mosher, Richard Leahy, Sylvain Baillet
We are now going to process our continuous recordings to remove the main sources of noise. Typically, we can expect contaminations coming from the environment (power lines, stimulation equipment, building vibrations) and from the subject (movements, blinks, heartbeats, breathing, teeth clenching, muscle tension, metal in the mouth or the body). In this tutorial, we will focus first on the noise patterns that occur continuously, at specific frequencies.
We can correct for these artifacts using frequency filters. Usually we prefer to run these notch and band-pass filters before any other type of correction, on the continuous files. They can be applied to the recordings without much supervision, but they may create important artifacts at the beginning and the end of the signals. Processing the entire continuous recordings at once instead of the imported epochs avoids adding these edge effects to all the trials.
Contents
Evaluation of the noise level
Before running any type of cleaning procedure on MEG/EEG recordings, we always recommend to start with a quick evaluation of the noise level. An easy way to do this is to estimate the power spectrum of all the signals over the entire recordings.
- Clear the list of files in the Process1 tab.
Select the three datasets we have linked to our protocol.
You can select the three "link to raw file" nodes, the three folders or the entire subject node.

- Click on [Run] to open the pipeline editor window.
Select the process "Frequency > Power spectrum density (Welch)"
This process evaluates the power of the MEG/EEG signals at different frequencies, using the Welch's method (see Wikipedia or MathWorks). It splits the signals in overlapping windows of a given length, calculates the Fourier Transform (FFT) of each of these short segments, and averages the power of the FFT coefficients for all the overlapping windows.
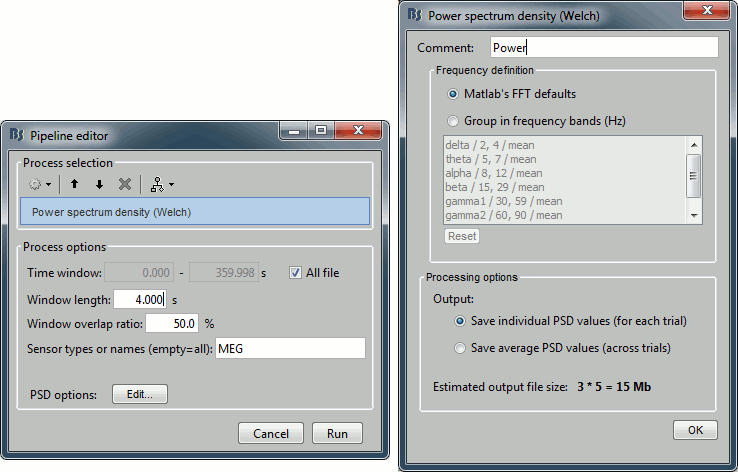
- Set the options as follows (click on [Edit] for the additional options):
Time window: [All file]
Portion of the input file you want to use for estimating the spectrum.
It is common to observe huge artifacts at the beginning or the end of the recordings, in this case you should exclude these segments from the calculation of the PSD.
In practice, using just the first 100s or 200s of the file can give you a good enough impression of the quality of the recordings.Window length: 4 seconds
Estimator length = length of the overlapping time windows for which we calculate the FFT. The number of time samples in the estimator is the same as the number of frequency bins in the output file. Increasing this parameter increases the output frequency resolution (distance between two frequency bins) but degrades the stability of the estimator, as it also decreases the total number of averaged time windows.Overlap: 50%
How much overlap do we want between two consecutive time windows.Sensor types or names: MEG
Defines the list of channels (names or types) on which you want to apply the process.Frequency definition: Matlab's FFT default
You have the option to directly use the frequency binning returned by the FFT, or run an additional step of averaging these bins in larger frequency bands. Note that you can freely edit these frequency bands.Output: Save individual PSD value.
This option will separately estimate the PSD for each of the three files in input, and create three files in output. If you select the other option (save average), it calculates the same three files but averages them on the fly and saves only one file in the database.
- Click on [Run] to start the execution of the process.
Troubleshooting: If you get "Out of memory" errors, try to run this PSD estimation on a shorter time segment. For example, set the time window to [0,100s] instead of the full file. This process starts by loading all the needed recordings in memory, you might not have enough memory available on your system to fit the entire dataset.
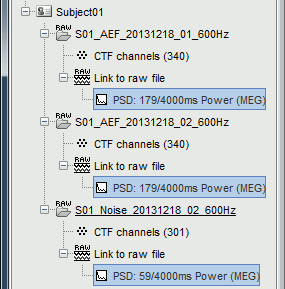
It produces three new files, that appear as "depending" on the three datasets. The comments of the files indicate how many overlapping windows could be used to estimate the PSD. "179/4000ms" means 179 windows of 4s each (total 716s). With the 50% overlap, it sums up to a little less than 2x the file length (360s).
Interpretation of the PSD
File: AEF#01
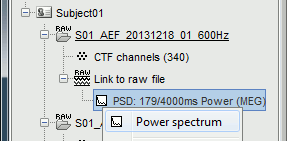
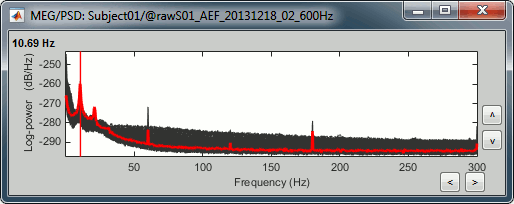
Double-click on the new PSD file for run #01 to display it (or right-click > Power spectrum).
- The power spectrum is displayed in a figure similar to the time series, but the X axis represents the frequencies. Most of the shortcuts described for the recordings are also valid here. Clicking on the white parts of the figure or using the arrow keys of the keyboard move the frequency cursor. The current frequency can also be controlled with a new slider displayed in the Brainstorm window, just below the time panel.
Each black line represent the power spectrum for one channel. If you click on a channel, it gets highlighted in red. Click again for deselecting. Right-click on a channel to read its name.
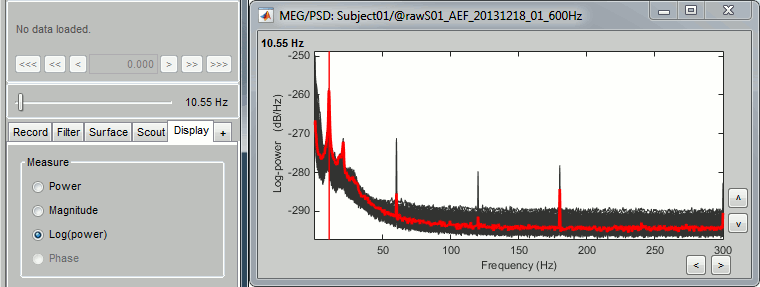
The frequency resolution of this power spectrum, ie. the distance between to frequency bins represented in this figure, is about 0.15Hz. This precision depends on the length of the estimator window you used. The FFT is computed on the number of time samples per window (4s*600Hz), rounded to the next power of 2 (nextpow2), and represents the full spectrum of the file (0-600Hz).
Frequency resolution = sampling_freq / 2^nextpow2(estimator_length*sampling_freq) = 0.1465 Hz- The shape of this graph is normal, it does not indicate anything unexpected:
Peaks related with the subject's alpha rhythms: around 10Hz and 20Hz.
Peaks related with the power lines: 60Hz, 120Hz and 180Hz.
These datasets were recorded in Canada, where the alternating powerline current is delivered at 60Hz. In Europe you would observe similar peaks at 50Hz, 100Hz and 150Hz.
- Add a topography view for the same file, with one of the two methods below:
Right-click on the PSD file > 2D Sensor cap.
Right-click on the spectrum figure > 2D Sensor cap (shortcut: Ctrl+T)
Scroll in frequencies to see the spatial distribution of each frequency bin:

- We have already identified two artifacts we will need to remove: the eye movements and the 60Hz+harmonics from the power lines.
File: AEF#02
Open the spectrum view for the run AEF#02.
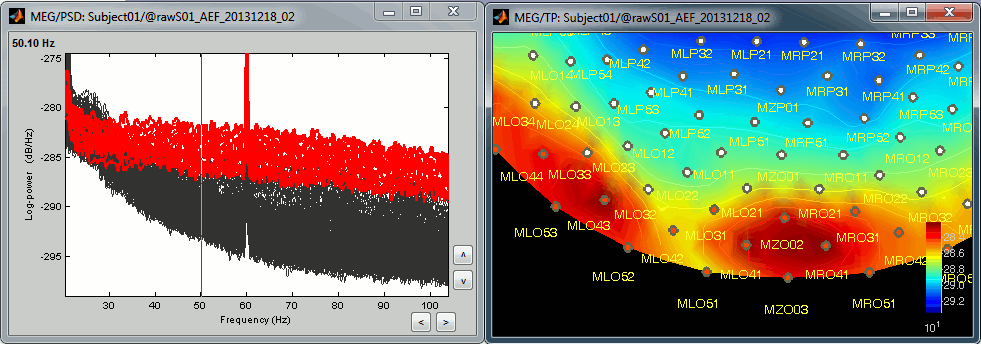
Add a 2D sensor cap view for the same file. Scroll to zoom in/out.
To display the sensor names, right-click on the figure > Channels > Display sensors.- This spectrum looks very similar to the run #01: same alpha and power line peaks.
Additionally, we observe higher signal power between 30Hz and 100Hz on many occipital sensors. This is probably related to some tension in the neck muscles due to an uncomfortable seating position in the MEG. We will see later whether these channels need to be tagged as bad or not.
File: Noise recordings
Open the spectrum view for the noise recordings.
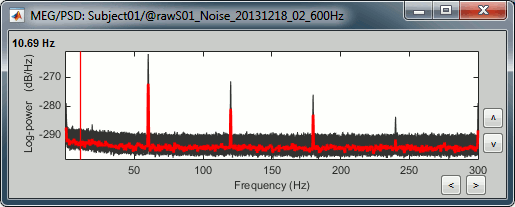
- This shows the power spectrum of the signals that are recorded when there is no subject in the MEG room. It gives a good and simple representation of the instrumental noise. If you had one bad MEG sensor, you would see it immediately in this graph. Here everything looks good.
What filters to apply?
When to apply them? Continuous files, before SSP for easier processing.
Important: Frequency filters are operations that you should apply at very early stages of the analysis, before epoching the recordings. These operations do not perform well next to the beginning and the end of the signals, they may generate important artifacts. It is therefore much more efficient to filter the entire recordings from the original continuous file at once, rather than filtering small epochs after importing them in the database.
It is not always recommended to use filters to remove the 50/60Hz frequencies, it depends on what you are expecting to do with your recordings. In the case of an ERP analysis, the averaging of multiple trials will get rid of the power line frequencies because they are not time-locked to the stimulus. If you are going to filter the recordings below 40Hz or if you do all your analysis in the time-frequency domain, you don't need this either. Avoid any pre-processing step that you don't really need.
Alternatives to the notch
If the notch filter is not giving satisfying result, you can use two other processes.
Sinusoid removal: This process can do a better job at removing precise frequencies by identifying the sinusoidal components and then subtracting them from the signals in the time domain. This is not a frequency filter and works best on short segments of recordings: run it on the imported epochs rather than on the continuous files.
Band-stop filter: This process can be useful for removing larger segments of the spectrum, in case the power line peaks are spread over numerous frequency bins or for suppressing other types of artifacts.
High-pass filter: Removes the low frequencies from the signals. This could be used for:
Removing the slow fluctuations of the arbitrary baseline value of the MEG sensors (< 0.2Hz).
Removing the artifacts occurring at low frequencies (< 1Hz, e.g. breathing or eye movements).
Doing a baseline correction of the EEG/MEG recordings when there is no clear pre-stimulus baseline in the experiment or in the case of long epochs or resting state recordings (> 5s).
Low-pass filter: Removes the high frequencies from the signals. This could be used for:
- Removing some strong noise occurring at high frequencies.
Facilitating the interpretation of the signals: if you are interested only in lower frequencies (for instance < 20Hz), everything in the higher part of the spectrum is just noise in your analysis.
Both filters are accessible using the process Pre-process > Band-pass filter.
Why do we need to process the empty room measurements?
All the filters that are applied to the experiment data also need to be applied to the noise recordings. In the source estimation process, we will need all the files to have similar levels of noise, especially for the calculation of the noise covariance matrix.
Notch filter
For illustration purposes, we will now run a frequency filter to remove the 60Hz+harmonics from the continuous files. Notch filters are adapted for removing well identified contaminations from systems oscillating at very stable frequencies.
Keep all the three datasets selected in the Process1 box.
Remember to always apply the same filters on the subject recordings and the noise recordings.- Click on [Run] to open the Pipeline editor.
Run the process: Pre-process > Notch filter
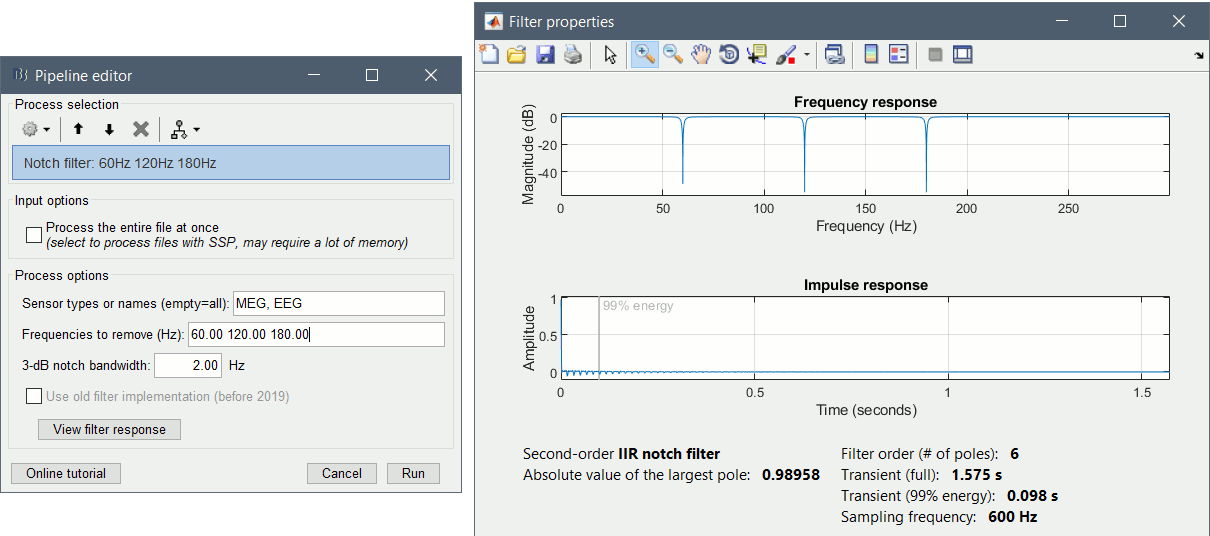
Process the entire file at once: NO
Select the frequencies: 60, 120, 180 Hz
Sensor types or names: MEG
- The higher harmonics (240Hz) are not clearly visible, and too high to bother us in this analysis.
This process creates three new datasets, with additional "notch" tags. These output files are saved directly in the Brainstorm database, in a binary format specific to Brainstorm (.bst).
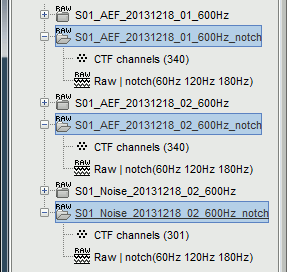
- If you delete the folders corresponding to the original files (before the filter), your original recordings in the .ds folders are not altered. If you delete the folders corresponding to the filtered files, you will lose your filtered recordings in .bst format.
To check where the file corresponding to a "Link to raw file" is actually saved on the hard drive, right-click on it > File > Show in file explorer.
- Remember this is an optional processing step. Whether you need this on your own recordings depends on the analysis you are planning to run on the recordings (see section above).
Evaluation of the filter
Right-click on the Process1 list > Clear list.
Drag and drop the three filtered files in Process1.
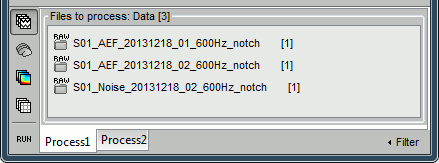
Run again the PSD process "Frequency > Power spectrum density (Welch)" on the new files, with the same parameters as before, to evaluate the quality of the correction.
Double-click on the new PSD files to open them.
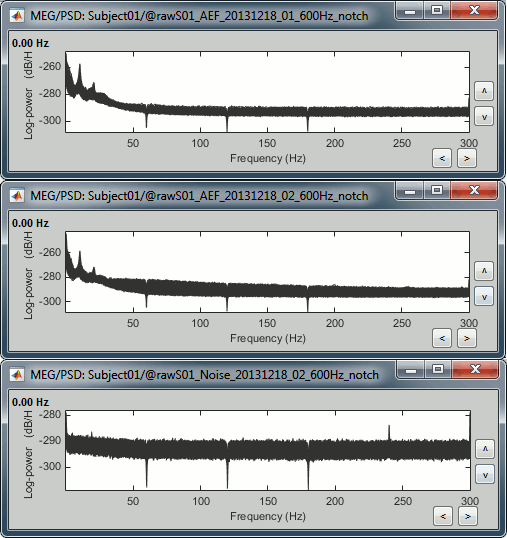
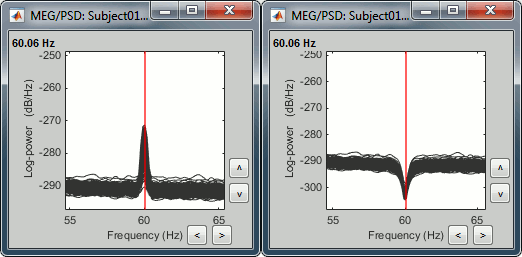
Scroll to zoom in and observe what is happening around 60Hz (before / after).
Some cleaning
To avoid the confusion later, delete the links to the original files:
Select the folders containing the original files and press Delete (or right-click > File > Delete).
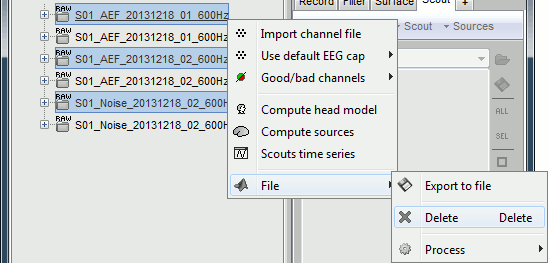
Always read the confirmation messages carefully, you will avoid some bad surprises.

This is what your database explorer should look like at the end of this tutorial:
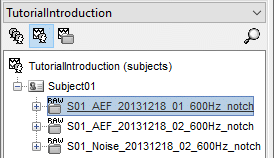
Filters specifications
Notch filter
Description: IIR notch filter with zero-phase lag (implemented with filtfilt), 4th order.
Reference: MatlabCentral #292960
Function: brainstorm3/toolbox/process/functions/process_notch.m
External call: x = process_notch('Compute', x, sfreq, FreqList)
Code:
    % Remove the mean of the data before filtering
    xmean = mean(x,2);
    x = bst_bsxfun(@minus, x, xmean);

    % Define a default width
    FreqWidth = 1;
    % Define coefficients of an IIR notch filter
    delta = FreqWidth/2;

    % Pole radius
    r = 1 - (delta * pi / sfreq);
    theta = 2 * pi * FreqList(i) / sfreq;
    % Gain factor
    B0 = abs(1 - 2*r*cos(theta) + r^2) / (2*abs(1-cos(theta)));
    % Numerator coefficients
    B = B0 * [1, -2*cos(theta), 1];
    % Denominator coefficients
    A = [1, -2*r*cos(theta), r^2];
    % Filter signal
    x = filtfilt(B,A,x')';

    % Restore the mean of the signal
    x = bst_bsxfun(@plus, x, xmean);
Band-stop filter
Description: Butterworth IIR filter with zero-phase lag (implemented with filtfilt), 4th order.
Reference: FieldTrip: x = ft_preproc_bandstopfilter(x, sfreq, FreqBand, [], 'but', 'twopass')
Function: brainstorm3/toolbox/process/functions/process_bandstop.m
External call: x = process_bandstop('Compute', x, sfreq, FreqList, FreqWidth)
Code:
    % Remove the mean of the data before filtering
    xmean = mean(x,2);
    x = bst_bsxfun(@minus, x, xmean);

    % Nyqist frequency
    Fnyq = sfreq/2;
    % Frequency band to remove (default value FreqWidth=1.5)
    FreqBand = [FreqList(i) - FreqWidth/2, FreqList(i) + FreqWidth/2];
    % Filter order
    N = 4;

    % Butterworth filter
    [B,A] = butter(N, FreqBand ./ Fnyq, 'stop');
    % Filter signal
    x = filtfilt(B, A, x')';

    % Restore the mean of the signal
    x = bst_bsxfun(@plus, x, xmean);
Band-pass filter
Description:
Reference:
Function: brainstorm3/toolbox/math/bst_bandpass_fft.m
External call: x = bst_bandpass_fft(x, Fs, HighPass, LowPass, isFir2=1, isMirror=1)
Code:
On the hard drive
The names of the files generated by the process "Power spectrum density" start with the tag timefreq_psd, they share the same structure as all the files that include a frequency dimension.
To explore the contents of a PSD file created in this tutorial, right-click on it and use the popup menus File > View file contents or File > Export to Matlab.
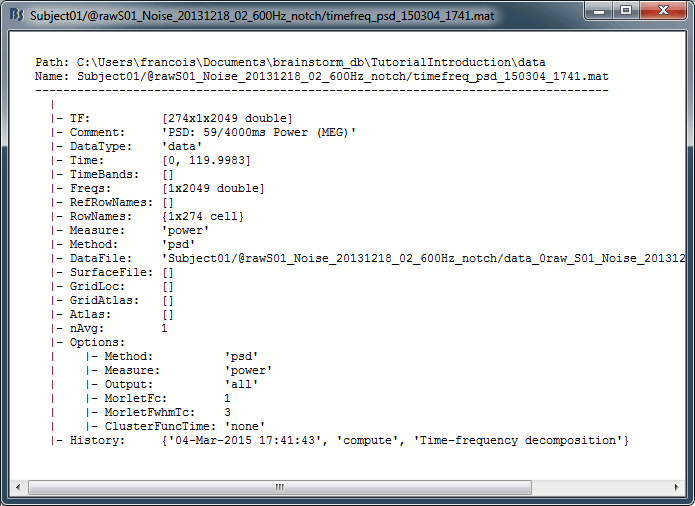
Structure of the time-frequency files: timefreq_*.mat
TF: [Nsignals x Ntime x Nfreq] Stores the spectrum information. Nsignals is the number of channels that were selected with the option "MEG" in the PSD process. Nfreq is the number of frequency bins. There is no time dimension (Ntime = 1).
Comment: String used to represent the file in the database explorer.
Time: Window of time over which the file was estimated.
TimeBands: Defined only when you select the option "Group in time bands".
Always empty for the PSD files because there is no time dimension.Freqs: [1 x Nfreq] List of frequencies for which the power spectrum was estimated (in Hz).
RefRowNames: Only used for connectivity results.
RowNames: [Nsignals x 1] Describes the rows of the TF matrix (first dimension). Here it corresponds to the name of the MEG sensors, in the same order as is the .TF field.
Measure: Function currently applied to the FFT coefficients {power, none, magnitude, log, other}
Method: Function that was used to produce this file {psd, hilbert, morlet, corr, cohere, ...}
DataFile: File from which this file was calculated = Parent file in the database explorer.
DataType: Type of file from which this file was calculated (file type of .DataFile).
- 'data' = Recordings
- 'cluster' = Recordings grouped by clusters of sensors
- 'results' = Source activations
- 'scouts' = Time series associated with a region of interest
SurfaceFile / GridLoc / GridAtlas / Atlas: Used only when the input file was a source file.
nAvg: Number of input files averaged to produce this file.
Options: Most relevant options that were passed to the function bst_timefreq.
History: Describes all the operations that were performed with Brainstorm on this file. To get a better view of this piece of information, use the menu File > View file history.