|
Size: 12682
Comment:
|
Size: 13074
Comment:
|
| Deletions are marked like this. | Additions are marked like this. |
| Line 18: | Line 18: |
| == MRI display == | == MRI Viewer == |
| Line 21: | Line 21: |
| {{attachment:popupMri.gif}} | . {{attachment:popupMri.gif}} |
| Line 23: | Line 23: |
| === MRI Viewer === This interface was already introduced in the previous tutorial. It corresponds to the default display menu if you double-click on the MRI from the database explorer. |
Select the MRI Viewer. This interface was already introduced in the previous tutorial. It corresponds to the default display menu if you double-click on the MRI from the database explorer. Let's describe a few more options: |
| Line 26: | Line 25: |
| * The ''Display options'' panel allows to hide some of the components. If the ''MIP/Anatomy ''checkbox is selected, the Maximum Intensity Power is displayed instead of the regular slices: At each point, the value displayed is the maximum value across all the slices. | * '''MIP Anatomy''': Maximum Intensity Projection. When this option is selected, the MRI viewer shows the maximum intensity value across all the slices in each direction. This maximum does not depend on the selected slice, therefore if you move the cursor, the image stays the same. * '''Neurological/Radiological''': Two standard ways displaying scans. In the neurological orientation, the left hemisphere is on the left of the image while in the radiological orientation the left hemisphere is on the right on the image. * '''Coordinates''': Position of the cursor in different coordinate systems, as described on this page: [[CoordinateSystems]]. The MNI coordinates are only available for the MRI volumes that have been transformed to the MNI stereotaxic space (for example the Colin27 and ICBM152 templates). * '''Popup menu''': All the figures have additional options available in a popup menu, accessible with a right-click on the figure. The colormap options will be described later in the tutorials, you can test the other options by yourself.<<BR>><<BR>> {{attachment:mriviewer.gif||height="266",width="295"}} {{attachment:mriviewer_mip.gif||height="266",width="295"}} |
| Line 28: | Line 30: |
| * The ''Coordinates ''panel shows the (x,y,z) coordinates in the coordinate systems managed by Brainstorm: MRI and SCS. * Once you're done, click on ''Cancel ''(unless you really want to save all your experiments). * There are many different ways to display the MR volumes. Right click on the ''T1-MRI'' in ''Default anatomy'', menu ''Display''. Just click everywhere and try all the options by yourself, it is the best way to learn.<<BR>><<BR>> ==== MRI Viewer ==== Already introduced in this tutorial<<BR>>It is the default visualization mode; when you double-click on the MRI file, it brings up the MRI Viewer. ==== Axial / coronal / sagittal slices ==== {{attachment:mriSlicesContact.gif||height="231",width="210"}} |
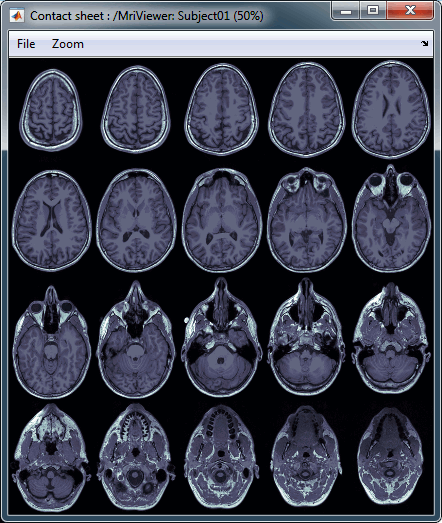
== MRI contact sheets == You can get collections of slices in any direction axial/coronal/sagittal with menus in the popup menu in the database explorer or from the popup menu in the MRI Viewer figure. |
| Line 45: | Line 36: |
| * Colormap selection in menu * Save as image in menu |
{{attachment:mri_axial.gif}} |
Tutorial 3: Display the anatomy
Authors: Francois Tadel, Elizabeth Bock, Sylvain Baillet
Contents
Anatomy folder
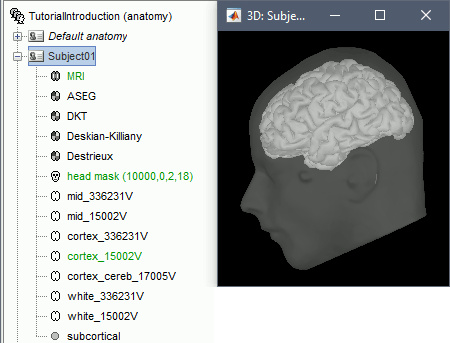
The anatomy of the subject "Subject01" should now contain all the files that Brainstorm could import from the FreeSurfer segmentation results:
MRI: T1-weighted MRI, resampled and re-aligned by FreeSurfer.
Head mask: Head surface, generated by Brainstorm.
If this doesn't look good for your subject, you can recalculate another head surface using different parameters: right-click on the subject folder > Generate head surface.Cortex_330142V: High-resolution pial envelope generated by FreeSurfer.
Cortex_15002V: Low-resolution pial envelope, downsampled from the original one by Brainstorm.
White_*: White matter envelope, high and low resolution.
Mid_*: Surface that represents the mid-point between the white and cortex envelopes.
Aseg atlas: Surfaces representing various sub-cortical regions identified by FreeSurfer.
For more information about the files generated by FreeSurfer, read the FreeSurfer page.

MRI Viewer
Right-click on the MRI to get the list of the available display menus:
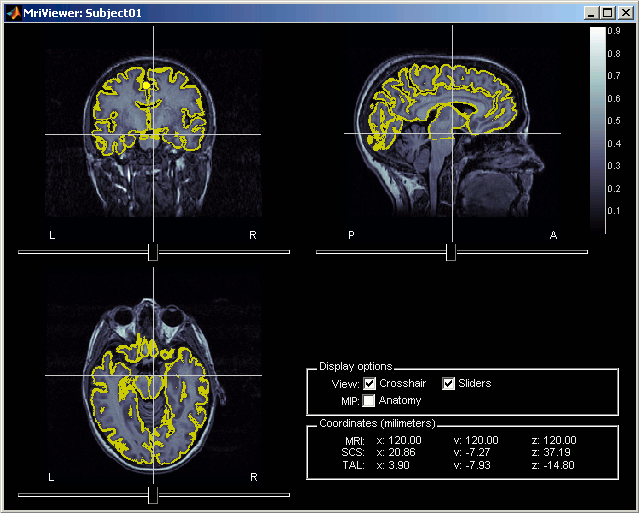
Select the MRI Viewer. This interface was already introduced in the previous tutorial. It corresponds to the default display menu if you double-click on the MRI from the database explorer. Let's describe a few more options:
MIP Anatomy: Maximum Intensity Projection. When this option is selected, the MRI viewer shows the maximum intensity value across all the slices in each direction. This maximum does not depend on the selected slice, therefore if you move the cursor, the image stays the same.
Neurological/Radiological: Two standard ways displaying scans. In the neurological orientation, the left hemisphere is on the left of the image while in the radiological orientation the left hemisphere is on the right on the image.
Coordinates: Position of the cursor in different coordinate systems, as described on this page: CoordinateSystems. The MNI coordinates are only available for the MRI volumes that have been transformed to the MNI stereotaxic space (for example the Colin27 and ICBM152 templates).
Popup menu: All the figures have additional options available in a popup menu, accessible with a right-click on the figure. The colormap options will be described later in the tutorials, you can test the other options by yourself.
![[ATTACH] [ATTACH]](/moin_static198/brainstorm1/img/attach.png)
![[ATTACH] [ATTACH]](/moin_static198/brainstorm1/img/attach.png)
MRI contact sheets
You can get collections of slices in any direction axial/coronal/sagittal with menus in the popup menu in the database explorer or from the popup menu in the MRI Viewer figure.
Zoom: mouse wheel (or two finger-move on a MacBook pad)
Move in zoomed image: click + move
Adjust contrast: right click + move up/down

3D orthogonal slices
- Simple mouse operations
Rotate: click + move
Zoom: mouse wheel (two finger-move on a MacBook pad)
Move object: left+right click + move
Move MRI slices: right click + move along direction of the slice
(or use the Resect panel in the Surface tab)Colormap contrast/brightness: click on the colorbar, and move up/down (brightness) or left/right (contrast)
Reset view: double click
Reset colormap: double-click on the colorbar
- Popup operations (right-click on the figure)
Colormap: Full Anatomy colormap edition (detailed in next tutorial)
MRI Display: For now, contains only the MIP option (Maximum Intensity Power). If checked, for each orientation: displays the maximum along all the slices instead of the proper slice.
Get coordinates: Pick a point in any 3D view and get its coordinates
Snapshots: save images or movies from this figure
Figure: change background color, display axes and menus for an advanced figure editing and management using Matlab tools.
Views: configure camera position with predefined settings.
- Keyboard shortcuts:
Notice the indications in the right part of the popup menu (CTRL+A in front of Figures>Axes, "1" in front of Views>Left), they represent the keyboard shortcut for each menu.
Views shortcuts (0,1,2...9 and "="): Remember them, they will be very useful when exploring the cortical sources. It is much faster to press a key to switch from left to right hemisphere, than having to rotate the brain with the mouse.
- Surfaces tab (in the Brainstorm main window):
- This panel is primarily dedicated to the surfaces display, but some controls can also be useful for the 3D MRI view.
Transparency slider
Smooth slider: it changes the threshold applied to the MRI slices. If you set it zero, you will see the full slices, as extracted from the volume.
Resect panel: you can change the position of the slices with the three sliders.
Surfaces visualization
There is only one way to display the surfaces: in 3D figures. To display a surface you can either double-click on it or right-click > Display.
- The mouse and keyboard operations are the same described for the 3D MRI display also apply here.
- If you display two surfaces from the same subject, they will be displayed on the same figure.
Open the Cortex surface and try all the buttons and sliders. Then do the same with the Scalp surface (Head). All the controls should have some effect on the display, except the sliders in the "Data options" panel. They are useful only when some additional data is mapped on the surfaces.
Multiple surfaces: If you have more than one surface in a figure, you need to select the surface you want to edit before changing its properties. The list of the available surfaces is displayed on top of the Surfaces tab.
You can also quickly add or remove surfaces in any 3D figure with the top-right buttons of the Surfaces tab.
Coordinates tab
- Close all the figures. Open the cortex surface again.
- Right-click on the 3D figure, select "Get coordinates". A new window appears.
Click anywhere on the cortex surface: a big yellow cross appears, and the coordinates of the point are displayed in all the available coordinates systems (see page: CoordinateSystems)
- MRI: MR volume, in millimeters (multiplied with the Voxsize field in the MRI file).
- SCS: Subject Coordinates System, in millimeters
- MNI: Montreal Neurological Institute standard coordinates
You can click on "View / MRI" to see where this point is located in the MRI, using the MRI Viewer.
![[ATTACH] [ATTACH]](/moin_static198/brainstorm1/img/attach.png)
![[ATTACH] [ATTACH]](/moin_static198/brainstorm1/img/attach.png)
Check registration with MRI
Your Subject01 anatomy is ready for source estimation. But before going further, you should always check that surfaces and MRI are well registered. When performing those steps a bit too fast, it is really easy to end up with a cortex envelope that is not aligned with the MRI. None of the following steps in source estimation will check that for you, and the sources estimated would be completely wrong.
Right-click on the Cortex surface > MRI Registration > Check MRI/surface registration...
- The calculation of the interpolation MRI-surface takes a few seconds, but it is then saved in the database and will be reused later.
- The yellow lines represent the re-interpolation of the surface in the MRI volume. The computation may take a while, but the result will be stored in the surface file, and will be useful for other operations anyway.
What happened on the hard drive
For most manipulations, it is not necessary to know exactly what is going on at the level of the file system, in the Brainstorm database directory. However, many things are not accessible from the Brainstorm interface, you may find sometimes useful to manipulate some piece of data directly from the Matlab command window.
The right-click > File menu, accessible on all the nodes in Brainstorm database explorer, offers many tools to interact with the file system and the Matlab environment.
Where are the files ?
Several ways to reach a file:
Leave your mouse during a few seconds over any node in the database explorer, and a tooltip will appear, with the name and path of the corresponding file on the hard drive.
![[ATTACH] [ATTACH]](/moin_static198/brainstorm1/img/attach.png)
Paths are relative to current protocol path (brainstorm_db/TutorialCTF). What is displayed in the Brainstorm window is a comment and may have nothing to do with the real file name. Eg. the Cortex surface's real file name is tess_cortex_pial.mat.
- Almost all the files in the database (imported data or computation results) are in Matlab .mat format. As a consequence, you can load them really easily in the Matlab environment, where they appear as structures with several fields.
Popup menu: File
Right-click on a surface file: many menus can lead you to the files and their contents:
View file contents: Display all the fields in the corresponding Matlab .mat file and the file path
![[ATTACH] [ATTACH]](/moin_static198/brainstorm1/img/attach.png)
View file history: Review the History field in the file, that records all the operations that were performed on the file since if was imported in Brainstorm
![[ATTACH] [ATTACH]](/moin_static198/brainstorm1/img/attach.png)
Export to file: Export in one of the supported mesh file format
Export to Matlab: Load the contents of the .mat file in the Matlab base workspace. It is then accessible from the Matlab command window.
Import from Matlab: Replace the selected file with the content of a variable from the Matlab base workspace. Useful to save back in the database some structures that where exported and modified manually with the Matlab command window.
Copy / Cut / Paste: Allow you to copy/move files in the database explorer. Keyboard shortcuts for those menus are the standard Windows shortcuts (Ctrl+C, Ctrl+X, Ctrl+V). The tree also support drag-and-drop operations for moving files between different folders.
Delete: Delete a file. Keyboard shortcuts: Delete key.
Rename: Change the Comment field in the file ("renames" the file in the database explorer, but does not rename the actual file on the hard drive). Keyboard shortcut: F2
Copy file path to clipboard: Copies the full file name into the system clipboard, so that you can paste it in any other window (Ctrl+V or Paste menu)
Go to this directory (Matlab): Change the current Matlab path, so that you can access the file from the Matlab Command window or the Matlab Current directory window
Show in file explorer: Open an explorer window in this directory (not working on all the systems...)
Open terminal in this folder: Start a system console in the file directory (Linux, Unix, MacOS only)
What are all those other files ?
If you look in your brainstorm_db/TutorialCTF directory with the file explorer of your operating system, you'll find many other directories and files that are not visible in Brainstorm database explorer.
![[ATTACH] [ATTACH]](/moin_static198/brainstorm1/img/attach.png)
The protocol TutorialCTF is divided in Anatomy and Datasets directories:
Each subject in anat is described by an extra file: brainstormsubject.mat
Each condition in data is described by an extra file: brainstormstudy.mat
anat/@default_subject: contains the files of the default anatomy (Default anatomy)
data/@default_study: files shared between different subjects (Global common files)
data/@inter: results of inter-subject analysis
data/Subject01/@default_study: files shared between different conditions in Subject01
data/Subject01/@intra: results of intra-subject analysis (across different conditions)

