Export figures to Plotly
Plotly is an online data analytics and visualization software that provides online graphing tools to promote collaboration and open data in the scientific community. This allows you to easily share data and plots between collaborators, or even provide an interactive figure for your papers.

It is now possible to automatically export some of the Brainstorm figures to a Plotly server. The following figures are supported: time series, time frequency, power spectrum and histogram.
Plotly Configuration
In order to send your figures to Plotly, you will first need to create an account to a Plotly server. If your institution has its own Plotly server, go ahead and create an account there (McGill users: see section below). Otherwise, you can create a free account on https://plot.ly/.
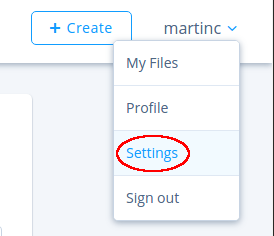
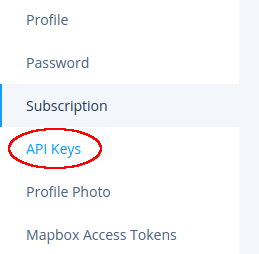
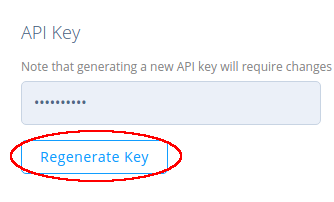
Brainstorm will need three things to connect to a Plotly server: your username, API key and domain name (if you're using a custom server). You choose your username during registration. In order to retrieve your API key, log in to your Plotly server and hover on your username (top right of the page) to go to Settings -> API Keys -> Regenerate Key. Take note of the newly generated API key. The domain name is the URL to your institution's custom Plotly server. Leave blank otherwise.
Exporting your figure from Brainstorm
In order to export your time series, time frequency or power spectrum figures, right click on it and select Snapshots -> Export to Plotly.
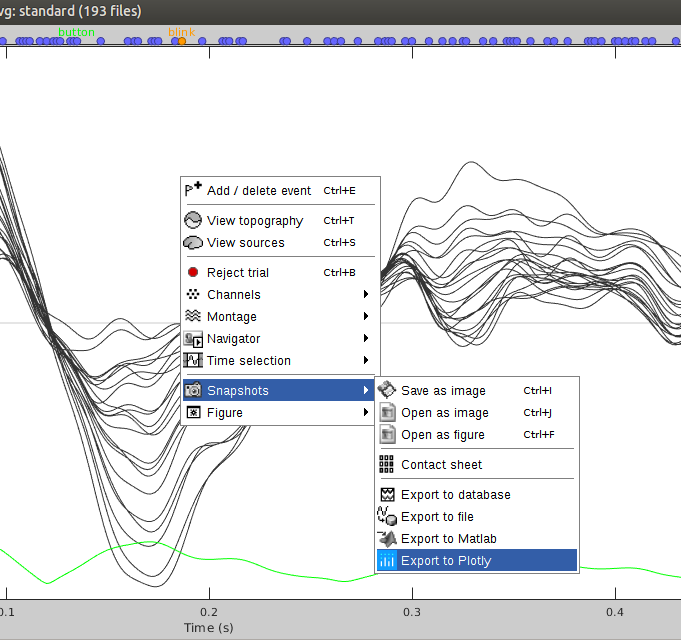
You will be prompted for your Plotly username, API key and domain (optional). Once entered, these fields will be saved and automatically populated the next time you export a figure for convenience.
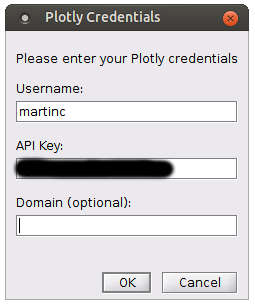
On your first execution, if the Plotly Matlab toolbox is not installed, you will be prompted to download and install it. This is required to use this feature.

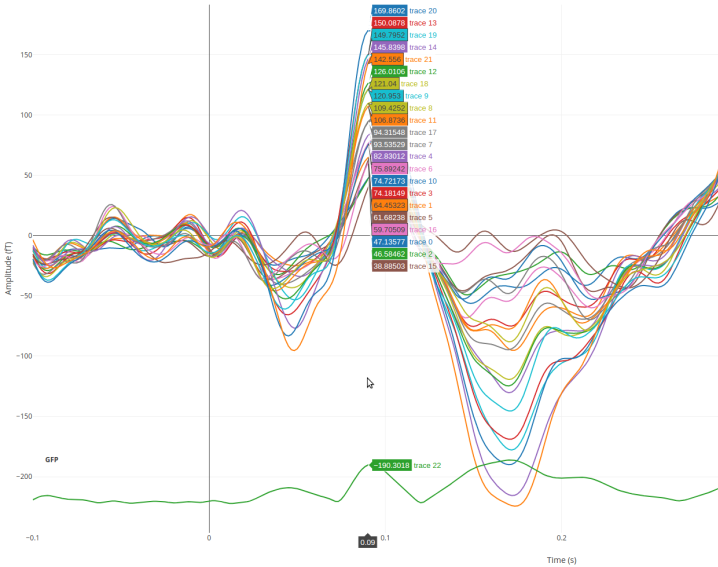
If successful, your figure will open up in the browser, and its URL will be displayed in the Matlab command window. You can then share this URL with collaborators.
Histogram
Histogram figures do not have right click menus. Instead, use the Plotly button available at the top, as shown below.
McGill's Plotly server
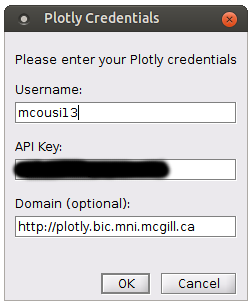
If you're a McGill student or staff, you can also use the following institution Plotly server: https://plotly.bic.mni.mcgill.ca/. You automatically have an account already with your McGill username. To use it in Brainstorm, paste the above URL in the domain field.
Gallery
Time Series
URL: https://plotly.bic.mni.mcgill.ca/~mcousi13/78
Time Frequency
URL: https://plotly.bic.mni.mcgill.ca/~mcousi13/66
Power Spectrum
URL: TODO