Tutorial 17: Visual exploration
Authors: Francois Tadel, Elizabeth Bock, Sylvain Baillet
This tutorial explores the options Brainstorm offers to represent graphically and explore interactively the evoked responses we computed in the previous tutorial. It shows how to produce spatial maps of the sensors, temporal averages, save screen captures and movies.
Contents
2D/3D topography
The sensor values at one time instant can be represented on a surface. Each amplitude value gets associated to a color using a colormap (described in the next tutorial). We call this type of representation "sensor topography", it shows the spatial distribution of the magnetic fields (or electric potentials).
Show the MEG signals for the standard average in Run#01 (double-click on the file). This gives us a direct feedback of the current time instant and allows to jump quickly somewhere else in time.
Right-click on the same file > MEG > select the menus: 3D sensor cap, 2D sensor cap, 2D disc.
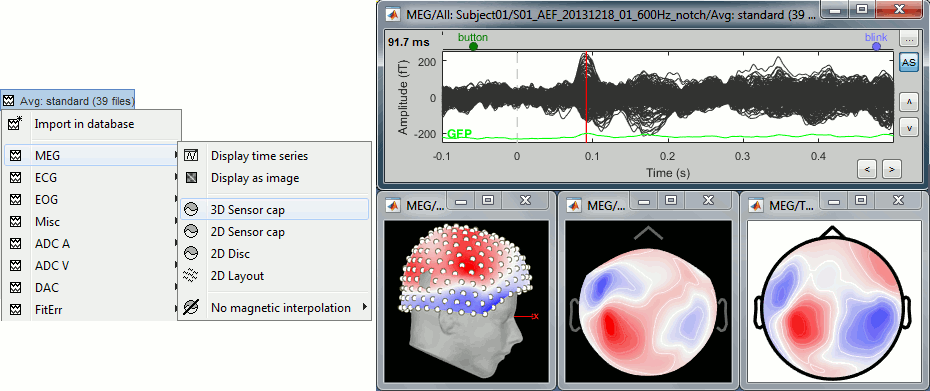
3D sensor cap: Represents the real 3D positions of the sensors. You
2D sensor cap: The sensors are projected on a 2D flat plane. Realistic distribution of the sensors.
2D disc: The sensors are projected on a sphere, then displayed as flat disc. Sometimes distorted...
In each of these views, you can add markers to indicate the sensors and their labels.
Right-click on the figure > Channels > Display sensors/labels (or Ctrl+E).- In the 3D view, you can notice a hole in the right-occipital area. It corresponds to a damaged sensor in the MEG system we used for collecting this dataset.
For EEG/sEEG/ECoG recordings, there is an additional representation mode available:
"3D Electrode". This will be detailed in the advanced tutorials corresponding to these modalities.

Magnetic interpolation
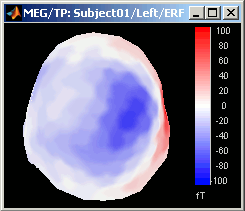
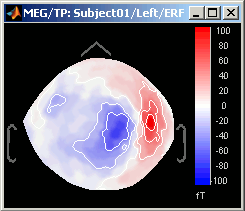
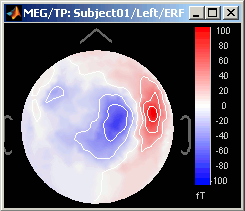
Some of the views (3D Sensor cap / 2D Sensor cap / 2D Disc), are by default re-interpolating the field that is recorded by the sensors to get much smoother displays. A simple inverse problem + forward problem are solved to reconstruct the magnetic fields on a high-resolution surface.
The menu "No magnetic interpolation" offer the same views, but without using this reconstruction of the magnetic field, and performing instead a spatial interpolation of the values between the sensors.
2D Layout
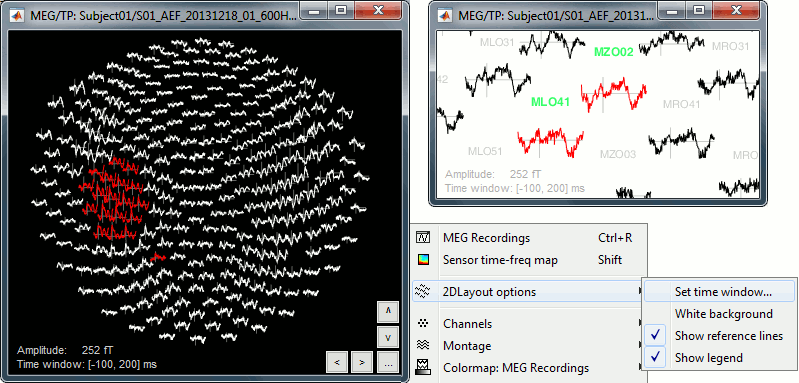
The menu 2D Layout allows to represent in the same figure the spatial information (the values for each channel is represented where the sensor is actually located) and the temporal information (instead of just one single value like in the topography views, we represent the signal around the current time).
The light gray lines represent the zero amplitude (horizontal) and the current time (vertical lines).
Only a part of the full time window is displayed for each channel, before and after the current time. The length of this time window can be modified either with the mouse shortcut Ctrl+wheel, or with the 2D Layout options, in the figure popup menu.
Time selection
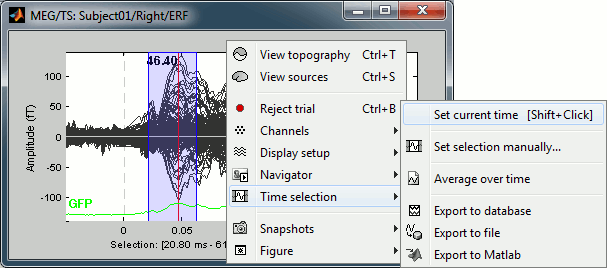
- Left-click somewhere on the white part of the time series figure, hold the mouse button, and drag your mouse left or right: A transparent blue rectangle appears to represent the time selection.
- Now right-click on the figure to see the functions you can apply on this time window. The selected time window and its duration are shown at the bottom of the figure.
Set current time: Just sets the time cursor when the right-click occurred. The shortcut Shift+Click can be useful when trying to move in time on dense displays in columns view.
Set selection manually: Select a time window by giving the bounds in ms.
Average time: Average over the selected time window, saved as a new file in the database.
Export to database: Extract the recordings and save them in a new file in database.
- If some sensors are selected, only their values are extracted, all the others are set to zero.
Export to file: Same, but in a user-defined file (not in the database)
Export to Matlab: Same, but export as a Matlab variable in the current workspace.
Snapshots
Using Brainstorm, you will quickly feel like saving the beautiful images you produce. For that you can:
Press the PrintScreen key on your keyboard and paste the copied screen in your favorite image or text editor (PC or Linux)
More subtle: Alt+PrintScreen would only copy the figure that is currently selected (PC or Linux).
On MacOS: Many more options available, Google for the best ones (see example).
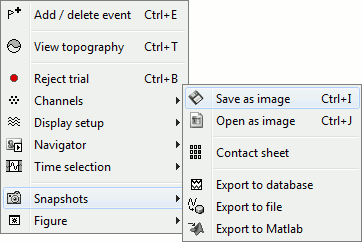
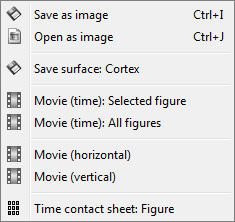
The Snapshots menu present in the popup of all the figures can be useful too. Here are two examples of Snapshots menus, respectively on time series and 3D figures:
 ---
--- 
Save as image: save the figure (without the title bar and borders) in a file. Many formats available.
Open as image: capture the figure and open it in as an image. This can be useful if you want to compare visually the selected figure with another one that you cannot display at the same time (because they have different time or frequency definitions)
Export to database: saves the recordings in the figure as a new entry in database
- If there are selected channels, only their values will be saved, the others being set to zero.
Save time series: extract the time series displayed in this figure (or only the selected sensors), and save them in a file. Available formats:
- ASCII (.txt)
- Matlab (.mat): saves much more information (titles, time values, etc.)
- Cartool (.eph)
- EGI (.raw)
Export to Matlab: Same thing, but exports the structure in a variable in Matlab workspace instead of creating a new file.
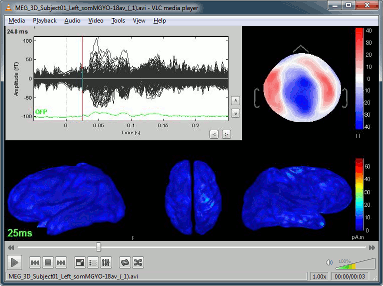
Movie (time): Selected figure: Create .avi movies to show time evolution of the selected figure.
- The dimensions of the movie image depend on the actual size of the figure on the screen.
- Don't do anything else while creating the movies: the figure which is captured must be visible all the time.
Movie (time): All figures: Instead of capturing one figure only, it captures them all and creates a movie showing what you see on the screen. Arrange your figures the way you want and create a movie of all your workspace at once.
Movie (horizontal/vertical): Rotate spatially the 3D scene.
Contact sheets
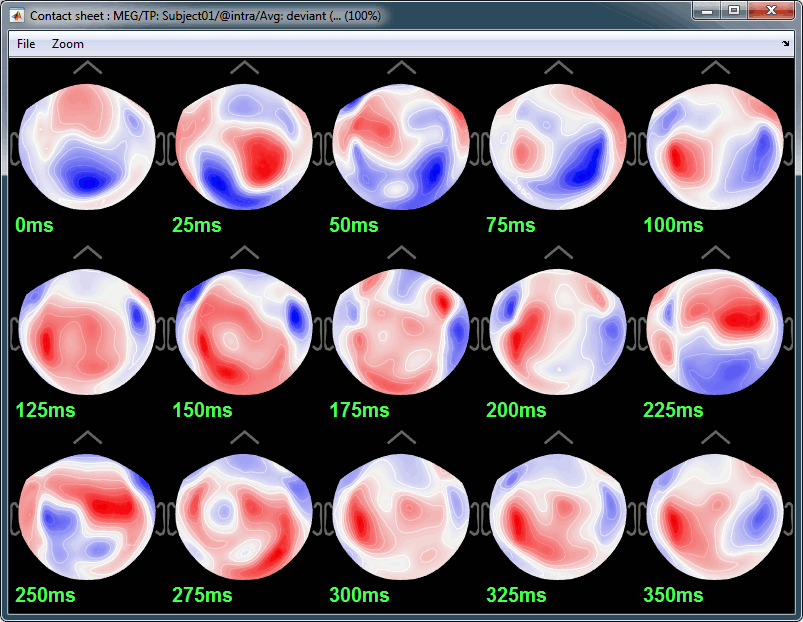
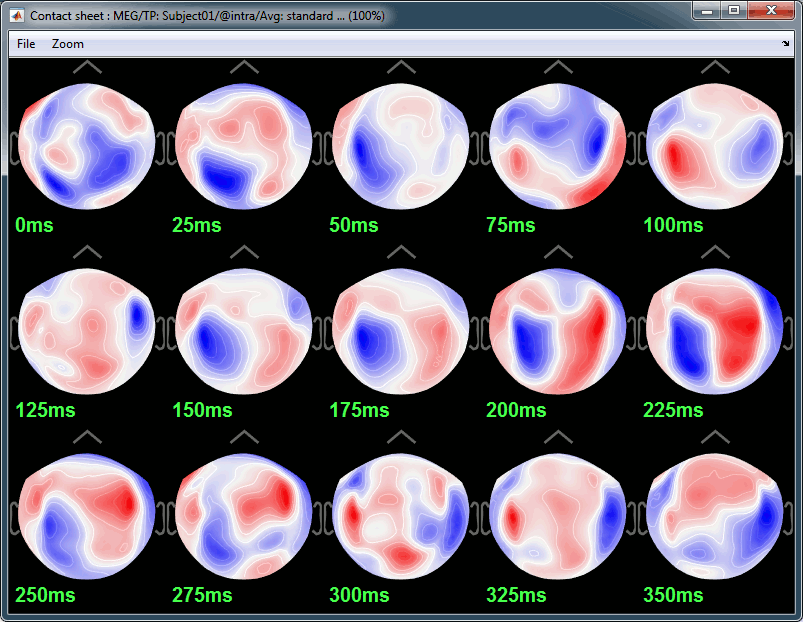
Contact sheet: Produce a big image with all the time frames in it.
- Same recommendations than for movies: if you don't want the final image to be too big, reduce the size of your figure, zoom a bit, and maybe hide the colorbar. Don't hide the figure during the capture.
At the end, the image is displayed in a viewer with which you can zoom (menu or wheel), move (left-click+move), and save the image (File > Save as).
- The contact sheet menu also appears for the time series figure, which is not that interesting because nothing changes except for the position of the time cursor. However, it can make sense to use in combination with the same contact sheet for a 2D/3D figure. Displaying the two images side by side you would have a clear view of the exact timing of each topography.
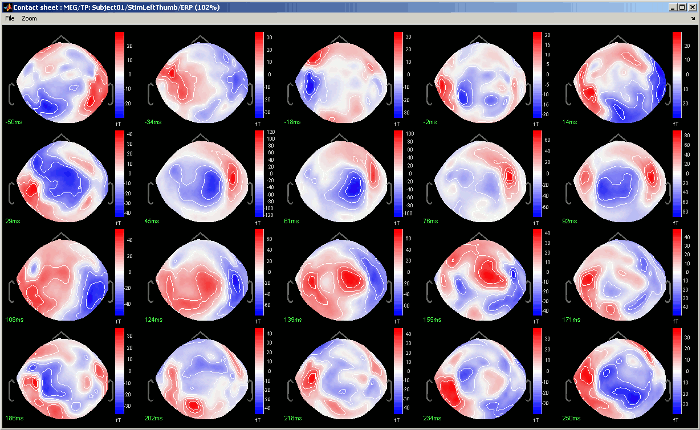
Figure menu: Various options to edit the selected figure.
Standard (right-click on the topography figure > Snapshot > Time contact sheet) :
Deviant:
Time average
Mouse shortcuts
Mouse wheel: Zoom / unzoom
Left click + move: Rotate (3D only)
Middle click + move: Or left+right click + move: Move in zoomed figure
Right click + move: Select sensors (2D only, when sensors are visible, see below)
Right click: Popup menu
Left click on the colorbar + move: Change contrast (up/down) and brightness (left/right)
Control + E: Display the channels markers and/or names
Keyboard arrows: Change current time
PageUp / PageDown: Change current time (10 samples at a time) / Mac: Fn+UP/Fn+Down
2DLayout
Mouse wheel: Zoom / unzoom
Middle click + move: (or left+right click + move) Move into the zoomed figure
Shift + mouse wheel: Increase/decrease the amplitude gain of the channels
Control + mouse wheel: Increase/decrease the length of the time window around the current time
Click on a line: Select a sensor
Right click + move: Select a group of sensors
Shift + click on a line: Select one sensor and unselect all the others Display the time-frequency decomposition for the selected sensor, when available
Right-click: Display popup menu. Sub-menu "2DLayout options" offer some configuration options for this type of figure.
Control + E: Display/hide the channels names
Keyboard arrows: Change current time
PageUp / PageDown: Change current time (10 samples at a time) / Mac: Fn+UP/Fn+Down
Keyboard shortcuts
Here is a memo of all the keyboard shortcuts for time series and topography figures. If you don't remember them, you can find most of them in the figure popup menus.
Arrows: left, right, PageUp, PageDown: Move in time
Delete: Mark selected sensors as bad
Shift + Delete: Mark non-selected sensors as bad (=keeps ony the selected sensors)
Enter: View time series for selected sensors
Shift + Enter: Set all the bad sensors as good (=brings back all the channels in the display)
Escape: Unselect all the selected sensors
Ctrl + A: Show axis on 3D figures (X,Y,Z)
Ctrl + B: Set trial as bad
Ctrl + D: Dock/undock figure in Matlab's figures list
Ctrl + E: Show sensors and labels (E stands initially for Electrode)
Ctrl + I: Save figure as image
Ctrl + R: Open Time series view (R stands for Recordings)
Ctrl + S: Open Sources view (see next tutorial)
Ctrl + T: Open 2D sensor cap view (T stands for Topography)
Shift + letter: Change sensors display when in "column" display mode for the time series.
F1, F2, F3: with or without Shift, calls the database navigator (F1=subject, F2=condition, F3=file)
- Notes for Mac users:
PageUp = Fn + UP
PageDown = Fn + DOWN
- F1 = Fn + F1
Mouse wheel = Two finger up/down on the MacBook pad
Graphic bugs
If you observe any other issue with these displays, there might be an issue with the OpenGL drivers.
Change the OpenGL rendering properties: Menu File > Set preferences.
- Update the drivers for your graphics card.
- Use a newer version of Matlab or the compiled version of Brainstorm.
