Tutorial 12: Explore the average response
Authors: Francois Tadel, Elizabeth Bock, Sylvain Baillet
Contents
From continuous tutorials:
Online filter
As introduced in the previous tutorials, you can add an online visualization filter to make the traces and the topographies look smoother. We suggest in this case a low-pass filter at 120Hz, because it shows very smooth traces, but all the waves we are interested in are still clearly visible in the MEG time series figure.

Explore the average
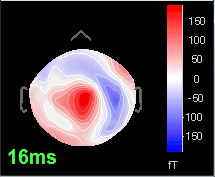
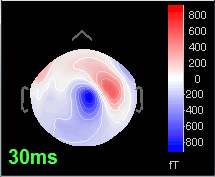
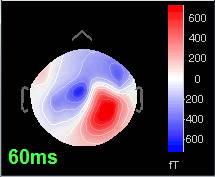
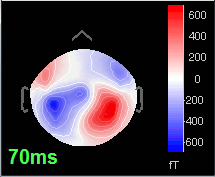
Open the time series for the "Avg: left". Then press Control+T, to see on the side a spatial topography at the current time point. Then observe what is happening between 0ms and 100ms. Start at 0ms and play it like a movie using the arrow keys left and right, to follow the brain activity millisecond by millisecond:
16 ms: First response, the sensory information reaches the right somatosensory cortex (S1)
30 ms: Stronger and more focal activity in the same region, but with a source oriented in the opposite direction (S1)
60 ms: Activity appearing progressively in a more lateral region (S1 + S2)
70 ms: Activity in the same area in the left hemisphere (S2 left + S2 right)


