Tutorial 12: Explore the average response
Authors: Francois Tadel, Elizabeth Bock, Sylvain Baillet
Contents
From continuous tutorials:
Online filter
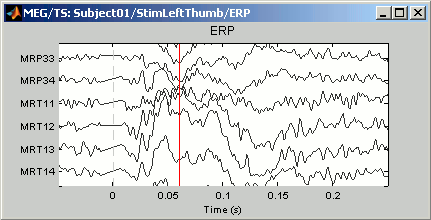
As introduced in the previous tutorials, you can add an online visualization filter to make the traces and the topographies look smoother. We suggest in this case a low-pass filter at 120Hz, because it shows very smooth traces, but all the waves we are interested in are still clearly visible in the MEG time series figure.

Explore the average
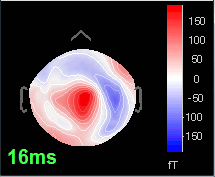
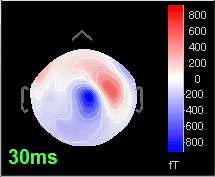
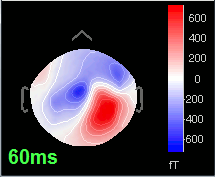
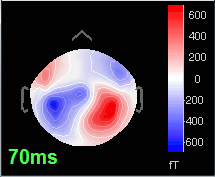
Open the time series for the "Avg: left". Then press Control+T, to see on the side a spatial topography at the current time point. Then observe what is happening between 0ms and 100ms. Start at 0ms and play it like a movie using the arrow keys left and right, to follow the brain activity millisecond by millisecond:
16 ms: First response, the sensory information reaches the right somatosensory cortex (S1)
30 ms: Stronger and more focal activity in the same region, but with a source oriented in the opposite direction (S1)
60 ms: Activity appearing progressively in a more lateral region (S1 + S2)
70 ms: Activity in the same area in the left hemisphere (S2 left + S2 right)
From CTF
Display recordings
Several display modes are available for recordings. They are all accessible with a right-click.The first four menus (MEG, MEG REF, Stim, Video), represent all the different types of channels that were found in the channel file. You can check that with Channel Edit (right-click on channel file > Edit). We are only interested in the "MEG" in this tutorial. Select Left / ERF > MEG > Display time series.
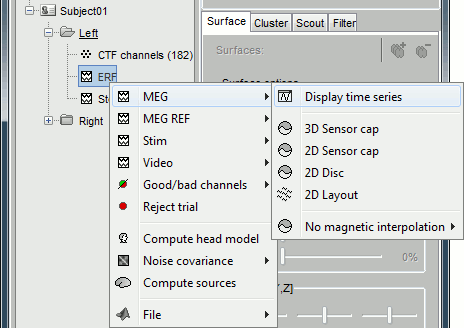
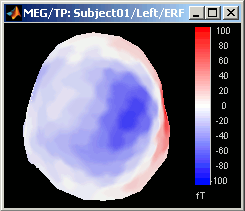
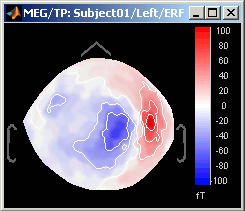
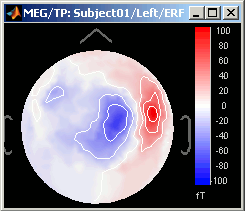
Now repeat this operation several times to display all the available modes: Display time series, 3D sensor cap, 2D sensor cap, 2D disc and 2D Layout. You should now see all the figures displayed below. Keep them opened for the next few paragraphs, you will learn how to manipulate multiple views of the same data.
Display time series
Amplitude fluctuations over time for all the sensors.
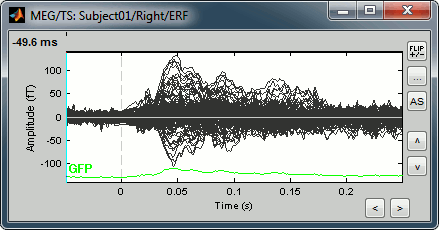
Buttons available on the figure:
[<] and [>]: Horizontal zoom around the current time point
[^] and [v]: Vertical zoom
[Flip +/-]: Exchange the direction of the Y axis, useful in clinical EEG
[...]: Set the amplitude range manually, ie. the limits of the Y axis
[AS]: Amplitude auto-scale. When selected, the amplitude range (Y axis limits) is updated automatically when the figure is updated. This is useful mostly when reviewing continuous files or individual trials, it will be illustrated in other tutorials.
List of mouse and keyboard operations for this type of figure (most of the operations are detailed later):
Mouse wheel: Horizontal zoom
CTRL+mouse wheel: Vertical zoom
Right click + move: Move in zoomed figure
Left click + move: Time selection
Left-click: Set current time
Left-click on a line: Select the corresponding sensor
Shift + Left-click: Force setting the current time, even when clicking on a sensor
Right-click: Popup menu
Double-click: Restore initial view (ie. unzoom)
Keyboard arrows: Change current time
PageUp / PageDown: Change current time (10 samples at a time)
- Notes for Mac users:
All the actions involving the mouse wheel can be performed on MacBook laptops by moving up and down two fingers on the pad.
"PageUp" or "PageDown" keys are obtained by pressing the "Fn" key together with the arrows UP or DOWN
3D Sensor cap / 2D Sensor cap / 2D Disc
The recordings at a given time instant and interpolated over a 2D or 3D surface.
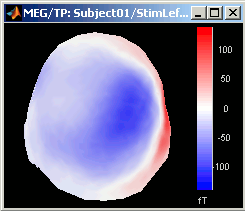
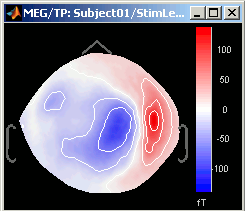
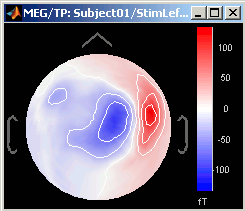
Keyboard and mouse shortcuts:
Mouse wheel: Zoom / unzoom
Left click + move: Rotate (3D only)
Middle click + move: Or left+right click + move: Move in zoomed figure
Right click + move: Select sensors (2D only, when sensors are visible, see below)
Right click: Popup menu
Left click on the colorbar + move: Change contrast (up/down) and brightness (left/right)
Control + E: Display the channels markers and/or names
Keyboard arrows: Change current time
PageUp / PageDown: Change current time (10 samples at a time) / Mac: Fn+UP/Fn+Down
2D layout
The time course of each channel is drawn at the actual position of the electrode, projected in 2D the same way as 2D Sensor cap. The light gray lines represent the zero amplitude (horizontal) and the current time (vertical lines).
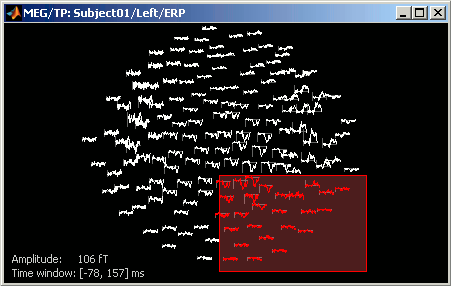
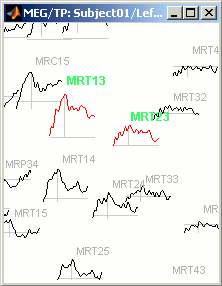
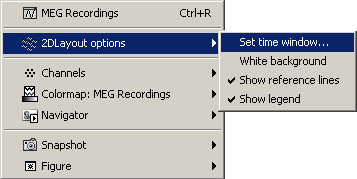
Only a part of the full time window is displayed for each channel, before and after the current time. The length of this time window can be modified either with the mouse shortcut Control+wheel, or with the 2D Layout options, in the figure popup menu. Other options are also available in the popup menu.
Mouse wheel: Zoom / unzoom
Middle click + move: (or left+right click + move) Move into the zoomed figure
Shift + mouse wheel: Increase/decrease the amplitude gain of the channels
Control + mouse wheel: Increase/decrease the length of the time window around the current time
Click on a line: Select a sensor
Right click + move: Select a group of sensors
Shift + click on a line: Select one sensor and unselect all the others Display the time-frequency decomposition for the selected sensor, when available
Right-click: Display popup menu. Sub-menu "2DLayout options" offer some configuration options for this type of figure.
Control + E: Display/hide the channels names
Keyboard arrows: Change current time
PageUp / PageDown: Change current time (10 samples at a time) / Mac: Fn+UP/Fn+Down
Magnetic interpolation
Some of the views (3D Sensor cap / 2D Sensor cap / 2D Disc), are by default re-interpolating the field that is recorded by the sensors to get much smoother displays. A simple inverse problem + forward problem are solved to reconstruct the magnetic fields on a high-resolution surface.
The menu "No magnetic interpolation" offer the same views, but without using this reconstruction of the magnetic field, and performing instead a spatial interpolation of the values between the sensors.
Important note
If you are experiencing any kind of graphic bug, you should try to disable the OpenGL renderer. In Brainstorm main window, select menu File > Set preferences, and check the option "OpenGL: Disabled (no transparency)". All the 3D views would be very slow and with no transparency, but it may solve all the problems. This is more likely to happen on 64bit machines or when working on a remote system (X-server, VirtualBox, Windows remote desktop connection...).
You may also try keeping the OpenGL renderer but typing "opengl software" before you run Brainstorm. It would force Matlab to do a software OpenGL rendering instead of using the 3D hardware accelerations. The display would be similar to hardware OpenGL but much slower.
Time exploration
The time window and the current time instant are centralized and managed from the top of the Brainstorm window. You can use the text box or the buttons to change the current time value. All the figures always stay synchronized, you cannot display the 2D disc topography at t=10ms and the 3D sensor cap topography at t=50ms at the same time. It might look too restrictive at the beginning, but the contrary would have made the interface much too complex; we wanted to keep it as simple and intuitive as possible.

The time window panel is not the best way to explore your recordings. There are many other shortcuts that are much faster to navigate through the time.
Click on time series figure: Left-click in any white area of the figure: it will move the time cursor at this point and update all the other figures to match this new value. Don't click on a black line, it would select the corresponding channel instead of moving the time cursor.
Press the keyboard arrows: Click on any data figure and try to press several time the left and right arrows, and also the PageUp and PageDown keys. This feature is really useful when you want to quickly see how the recordings are changing in time. Try holding the arrow keys for a while. It might be a bit slow because you have many figures to refresh at each time change. It is much faster if you have only one 2D figure to refresh.
To remember: An efficient and quick way to review your recordings just after importation is to:
- Open a Time series window (double click on recordings file)
- Click on the time of interest (eg. first response peak)
- Open a topography view of your choice (2D disc, 2D sensor cap, or 3D sensor cap)
You can do this by right-clicking on the time series figure > MEG Topography (or Ctrl+T keyboard shortcut).
Use the left/right arrows, and PageUp/PageDown keys (or Fn+Up / Fn+Down on a Mac)
Sensors selection
You can select some channels, and then display them separately or mark them as good or bad.
Now close all the figures except the Time series and the 2D Sensor cap topography (if you don't remember which one it was, close everything and open again these two figures).
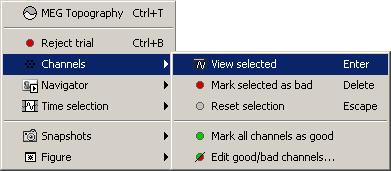
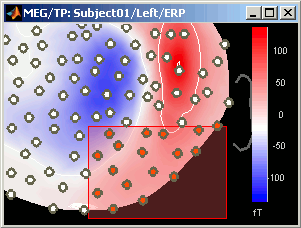
On 2D Sensor cap figure: right-click anywhere on the window > Channels > Display sensors. You'll see white dots representing the center of each MEG coil. Note that there is keyboard shortcut indicated for this menu: Ctrl + E.
Press Ctrl + E several times and see what happens. Come back to the display with only the sensors markers (no labels).
- Click on some white dots.
- They turn red and the corresponding lines in the time series window also turn red
- Left-click on the lines in the time series window: it also selects the sensors
- Right-click on a red line in time series figure: shows the name and index of the selected channel
- Click on a selected (red) point or line: the sensor is deselected.
To deselect all the sensors, press Escape or right-click > Channels > Reset selection
- Now select randomly three sensors.
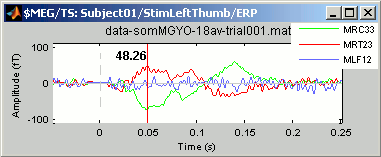
Right-click > Channels > View selected (Shortcut = Enter key). A new window is created, with only those three sensors, whose names are indicated in a legend box (you can move this legend if needed).
- Close that last figure. In the 2D topography figure, right-click and move the mouse to select a group of sensors, just to remember that this feature exists.
Time series in columns
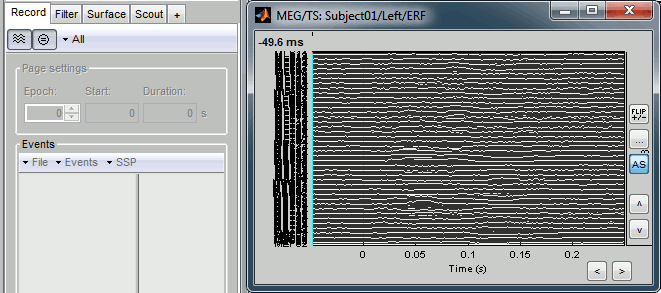
There are two display modes for the MEG signals: "butterfly", what we've seen until now, or "column". Double click on Left/ERP to open a time series figure. To switch from the current mode to the "column" mode, click on  in the Record tab.
- The figure you get is unreadable because it contains the 151 sensors in the same figure. There are several ways to get a readable display: you need to select a subset of the channels, zoom and/or to increase the gain of the channels.
- Start by maximizing the size of the figure. If you have a large screen, you might be already able to see something.
Channel gain: You can increase/decrease the amplitude of the traces in different ways:
- Click on the up/down buttons on the right side of the figure
- Click on the "..." button on the right of the window to set manually the gain value for each vertical unit in the graph (distance between two horizontal lines).
- Press the "+" or "-" keys on your keyboard
- Hold the SHIFT key down, and use the mouse wheel to zoom/unzoom
Vertical zoom: Hold the CTRL key down, and use the mouse wheel to zoom in or out.
Horizontal zoom:
Click on the "<" and ">" buttons at the bottom of the window
- Use the mouse wheel to zoom in or out.
Move in the zoomed figure: Hold down left and right buttons of the mouse, and move the mouse.
- You can reach some display results that are already a little more interesting:
Reset initial view: Double-click

