[TUTORIAL UNDER CONSTRUCTION]
It Will be completed soon
In this tutorial, we describe the full FEM process as described in the SPIE paper
We may keep the previous tutorial as basic and this tutorial is an advanced and complete version.
FEM tutorial: MEG/EEG Median nerve stimulation
Authors: Takfarinas Medani, Juan Garcia-Prieto, Wayne Mead.
This tutorial introduces the FEM modeling in the Brainstorm environment.
Note that the operations used here are not detailed, the goal of this tutorial is not to introduce Brainstorm to new users. For in-depth explanations of the interface and theoretical foundations, please refer to the introduction tutorials.
Contents
License
This tutorial dataset (MEG/EEG and MRI data) remains proprietary of xxxxyyyy. Its use and transfer outside the Brainstorm tutorial, e.g. for research purposes, is xxxx yyy.
Download the dataset
Get the open access reference data set from here : https://zenodo.org/record/3888381
The following data are used in the advanced tutorial FEM head modeling
Requirement
Brainstom
SimNibs
BrainSuite
Iso2mesh
Description of the experiment (todo) : only one file
The experiment consists of two stimulation protocols being conducted during a single scanning session in a MEG laboratory with an Elekta Triux (Megin, Finland) scanner. The subject is a right-handed 46 years old male. The two stimulation protocols consist of unilateral median nerve stimulation and an eyes-closed resting-state recording.
Median nerve stimulation:
- The stimulation signal was a square-wave pulse with 2Hz frequency and duration of 0.2ms.
- An ISI (inter-stimulus interval) of 500ms with a variation of ±20ms in order to be able to average out time-locked noise to the stimulation, while remaining unnoticeable by the subject.
- The stimulation was performed on both hands/wrists, independently, with a Digitimer DS7A stimulator. An electrode was placed on each current value were tuned to match the motor threshold of the subject on the stimulated hand, with a result of 10~12mA approximately.
- Initially, the left wrist was stimulated for approximately 2 minutes (this corresponds with the file containing L1 in its name). After a 2-minute rest, while sitting in the MSR and with his head in the helmet, the stimulation was repeated (L2 file). After this stimulation, the subject was asked to have a 10 minutes rest, during which he was allowed to sit calmly with his head out of the helmet, although remaining hooked to the scanner at all times. Finally, two subsequent runs of right wrist stimulation (R1 and R2 files) with an intermediate 2-minute rest were performed.
- Recordings were performed with a 1kHz sampling rate. Continuous HPI was disabled during these recordings. And high-pass filters were set to DC for MEG channels and 0.03Hz for EEG channels.
All files underwent a MaxFilter (version 2.3.13) tsss post-processing.
Resting-State protocol:
- The subject was recorded for approximately 80 minutes. Due to a 2GB maximum-size limitation for FIFF files, this translates into the recording being saved in files 'epi1' to 'epi4'.
- The subject had his eyes closed.
- Recordings were performed with a 1kHz sampling rate. Continuos HPI was enabled. High-pass filters were set to DC for MEG channels and 0.03Hz for EEG channels.
All files underwent a MaxFilter (version 2.3.13) tsss post-processing, with motion compensation active.
Download and installation
- Requirements: You have already followed all the introduction tutorials and you have a working copy of Brainstorm installed on your computer.
Go to the Download page of this website, and download the file: sample_tutoFEMadvance.zip
- Unzip it in a folder that is not in any of the Brainstorm folders (program or database folder)
- Start Brainstorm (Matlab scripts or stand-alone version)
Select the menu File > Create new protocol. Name it "tutoFEMadvanced" and select the options:
"No, use individual anatomy",
"No, use one channel file per condition".
Import the MRIs
- Switch to the "anatomical data" view, the left button in the toolbar above the database explorer.
Right-click on the tutoFEMadvanced folder > New subject > Subject01
- Leave the default options you set for the protocol
Right-click on the subject node > Import anatomy MRI: Navigate to the selected folder and then select the T1 MRI, with the name "T1.nii"
Set the 6 required fiducial points (indicated in MRI coordinates). Fiducials point not always have to be located where we recommend in our introductory and our coordinate systems tutorials. Every subject is different and sometimes things get in the way, and it is not possible to follow canonical recommendations. That is fine! As long as there is a correct correspondence between fiducial points in the fif file and in the MRI, everything works fine.
For the following subject you can use these values :
- - NAS: [121, 214, 50]
- - LPA: [45, 111, 31]
- - RPA: [174, 114, 56]
- - AC: [120, 130, 75]
- - PC: [120, 101, 73]
- - IH: [120, 110, 132]
Click on the link " Click here to compute MNI transformation" and keep the default values.
- Load the T2, by following the same process as previous, then select the T2 MRI with the name "m46wap_t2.nii". Brainstorm will ask you to register the T2 to the T1, select the SPM option (require to have SPM installed), then reslice the T2, select "Yes". This process will take few minutes.
Head model construction
FEM head model
The first step requires the generation of the FEM head model, where the MRIs are segmented into the main tissues and then tesselated into hexahedral or tetrahedral elements. The available methods within Brainstorm are listed in this page.
In the following tutorial, the SimNibs method is used
- Select both the T1 and the T2 MRIs, using the mouse and the "Shift" key
- Right-click on and then select the "Generate FEM mesh"
- Select the SimNIbs method from the panel and keep the default options.
In order to use the call SimNibs you need to have it installed on your computer, please follow the instruction as explained in here.
Keep all the options to their default values.
Depending on your computer performance, this process can take 2 to 4 hours, so be patient.
At the end of this computation, Brainstorm will populate the windows with the following nodes
- tissues: the segmentation output of the MRIs
FEM 72358V (simnibs, 5 layers) : the FEM mesh of the MRIs with 72353 vertices, generated with the method SimNibs and the model has 5 layers (wm, gm, csf, skull, and scalp).
- Head mask: the outer surface of the scalp (or the head)
- cortex_fem: the outer surface mesh of the grey matter
cortex_280753V: the pial surface generated by spm/cat within the SimNibs process
- cortex_15002V : low version of the cortex_280753
At the end of the process, make sure that the file "cortex_15002V" is selected (downsampled pial surface, which will be used for the source estimation). If it is not, double-click on it to select it as the default cortex surface.
FEM tensors
The FEM has the ability to incorporate anisotropic conductivity. Brainstorm offers the known methods to estimate the tensors from the DWI data. For a more detailed example please refere to this page.
There are two main phases to compute the tensors, the first is the computation of the DTI from the DWI. The second is the estimation of the conductivity tensors from the DTI on each of the FEM mesh elements.
Step one:
Right-click on the Subject01 > "Convert DWI to DTI"
- Select the DWI data from the folder, "dwi.nii", the associated files "dwi.bvec" and "dwi.bval" must be in the same folder (same name but different extensions)
BrainStorm will call internally the Brainsuite Software to compute the DTI. This process can take up to 20 minutes.
At the end of this process, a node will appear in the Brainstorm database explorer under the name "DTI-EIG", this is a volume data that contains the 12 values of the eigenvalues and eigenvectors at each voxel.
Explanation of the options:
Brainstorm recognizes the tissue listed on the FEM had and assigns the default isotropic conductivities, as shown on the panel, users can change and use their own values.
When the DWI data are computed, the conductivity tensors can be estimated on the white matter tissues using the Effective Medium Approach (EMA), Brainstorm offers two option, the EMA with a fixed factor k=0.736, or the EMA with the volume constraint (EMA+VC), please refer to this tutorial and the cited publication for further information.
Step two:
Once the DTIs are computed,
Richt click on the FEM mesh and then "Compute FEM tensors"
- From the panel select the options as shown in the following figure, then hit "Ok"
This process can take up to 5min, depending on the resolution of the FEM mesh.
Visualisation of the FEM mesh and tensors
Brainstorms include the possibilities to display the FEM head models and the tensors, users can also overlay the display with the MRI as well as with the different surfaces.
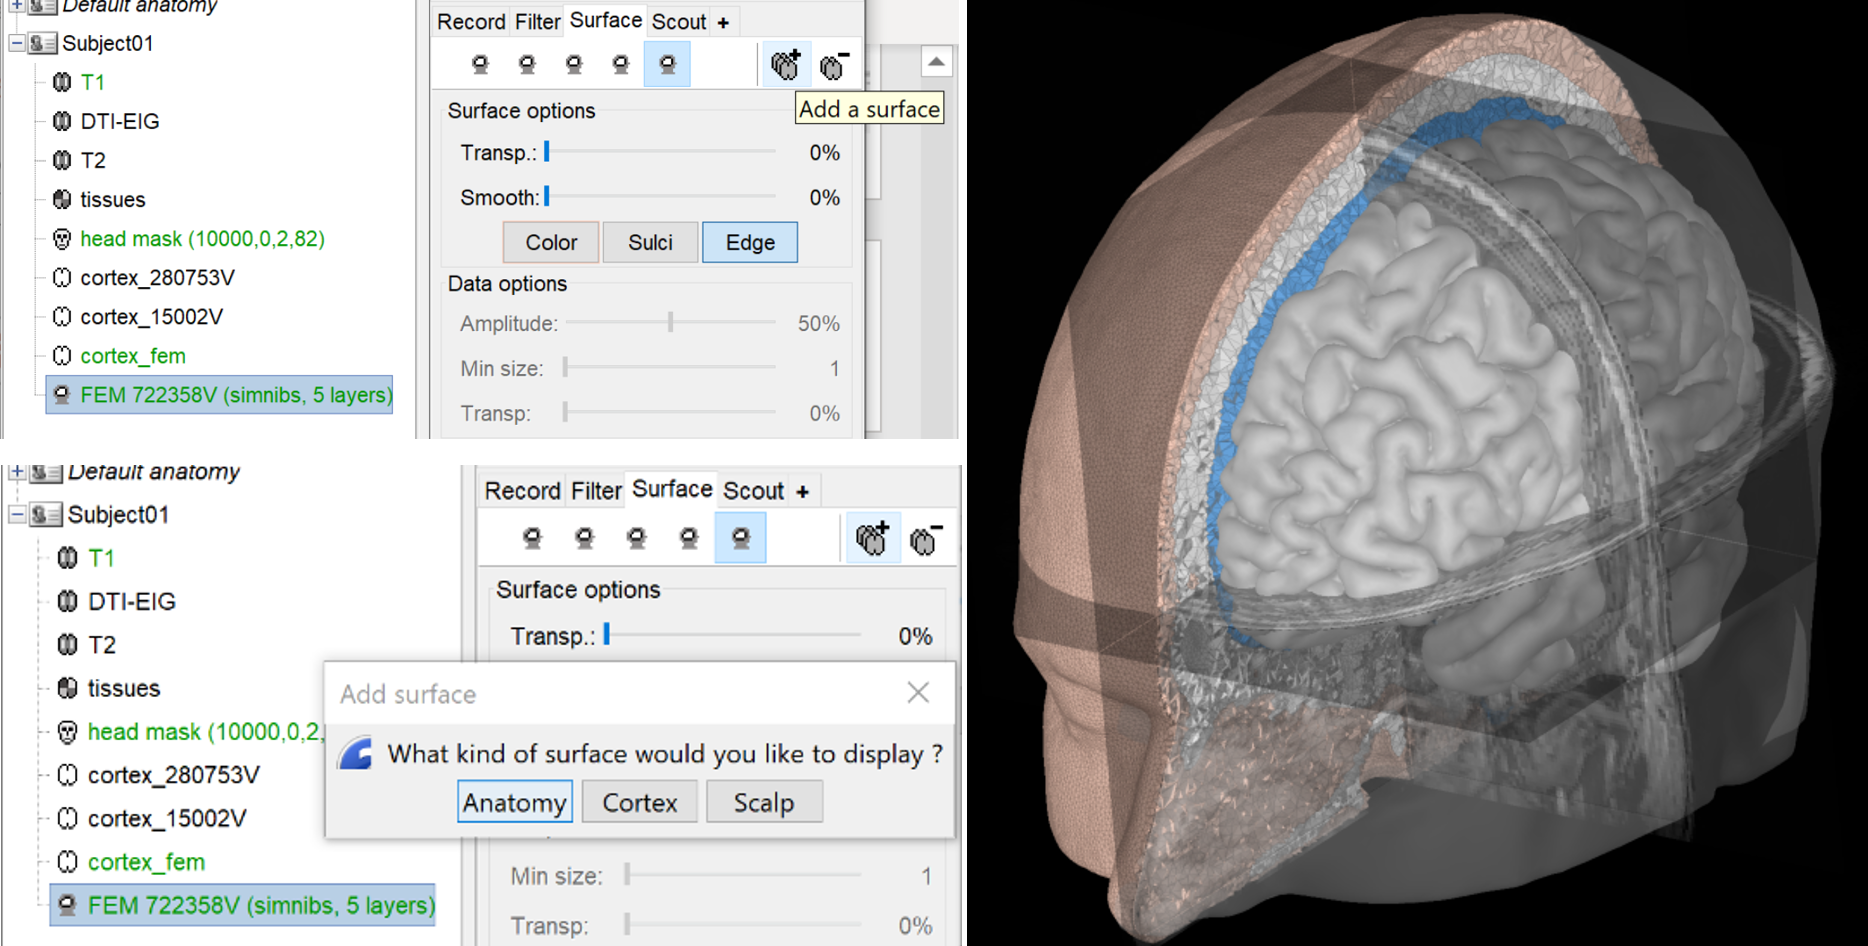
The FEM tensors can be also displayed either on the mesh or on the MRI, to do so, right-click on the FEM mesh, then "Display FEM tensors", you can choose the displaying mode, the tensors can be displayed either as arrows (line) on the main eigenvector or as ellipsoids, on each FEM element (tetrahedron).

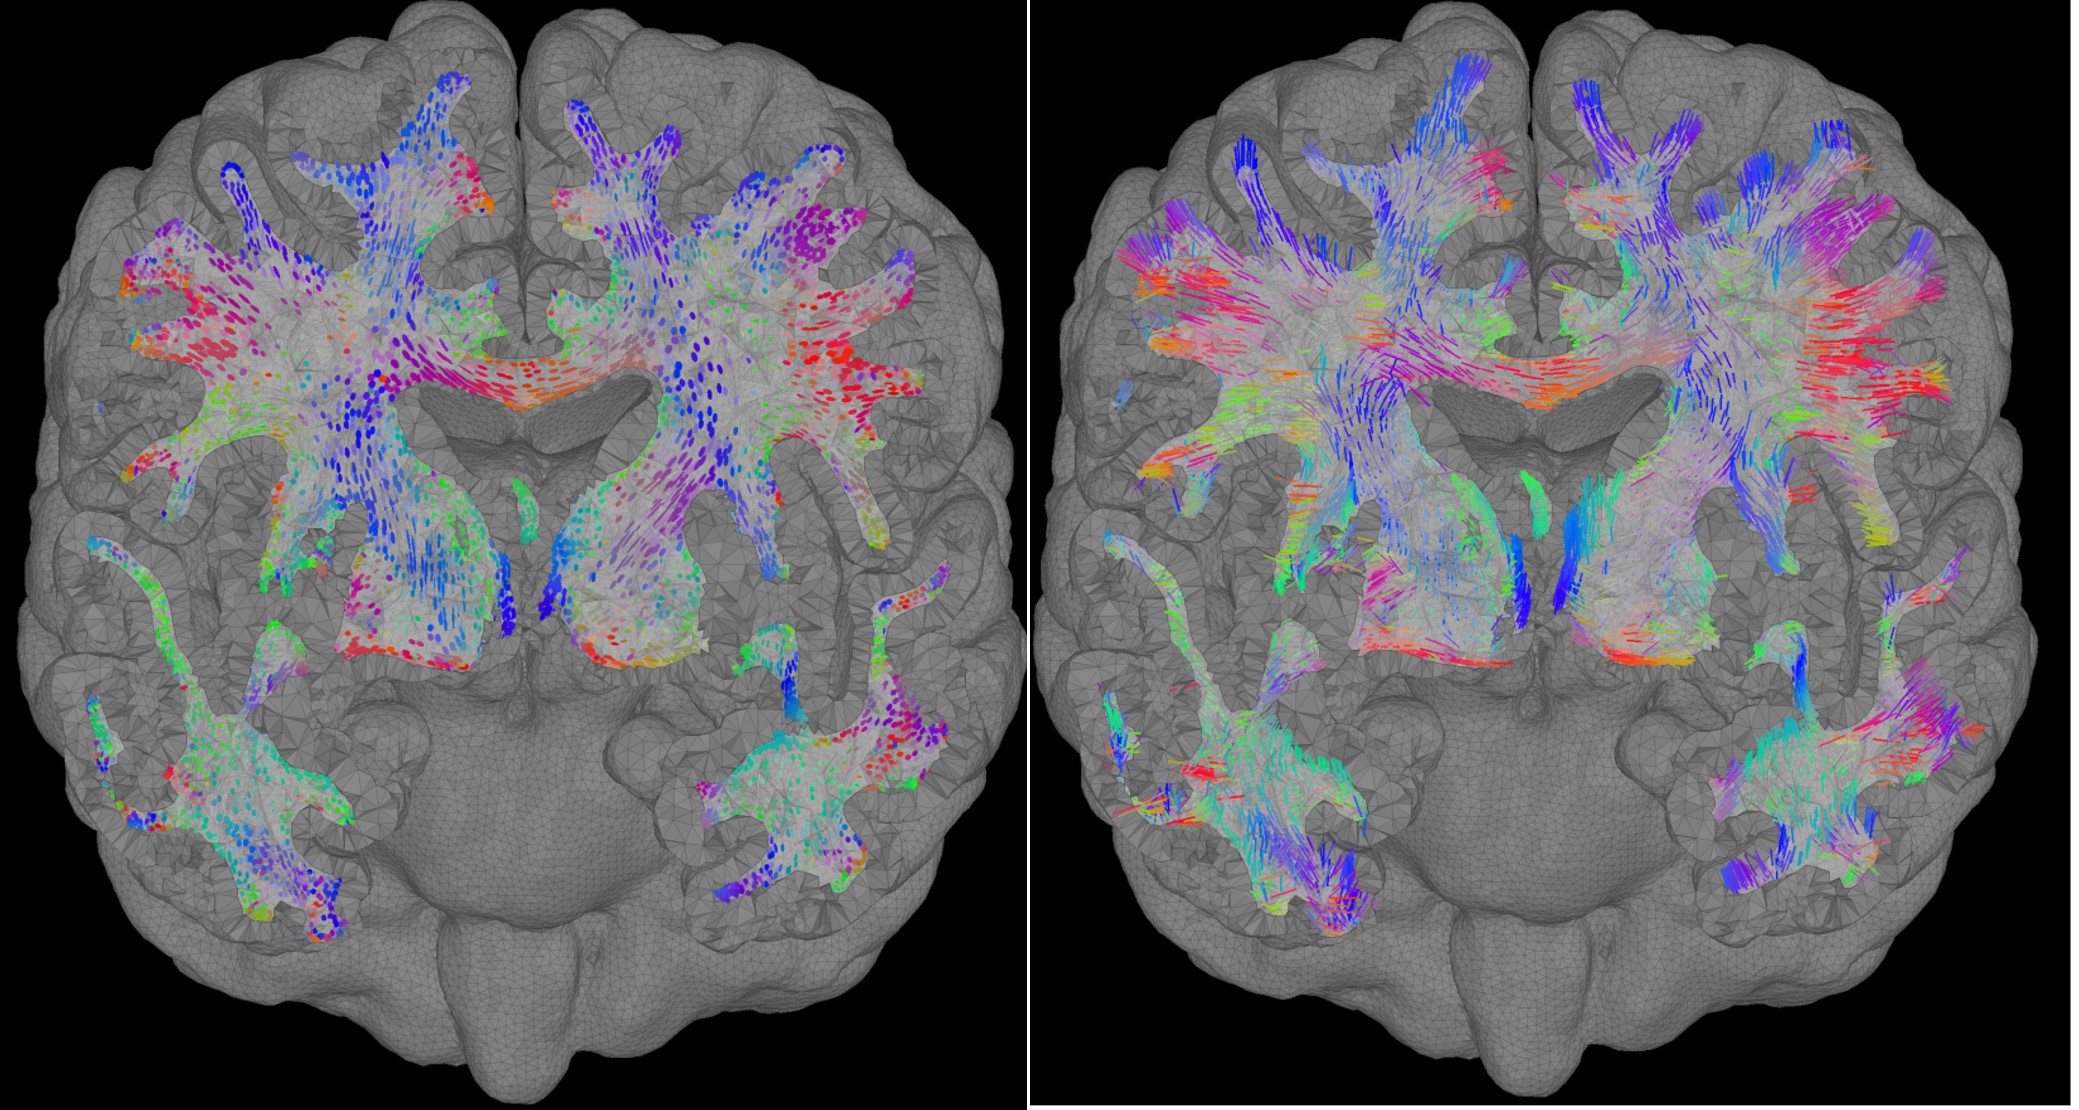
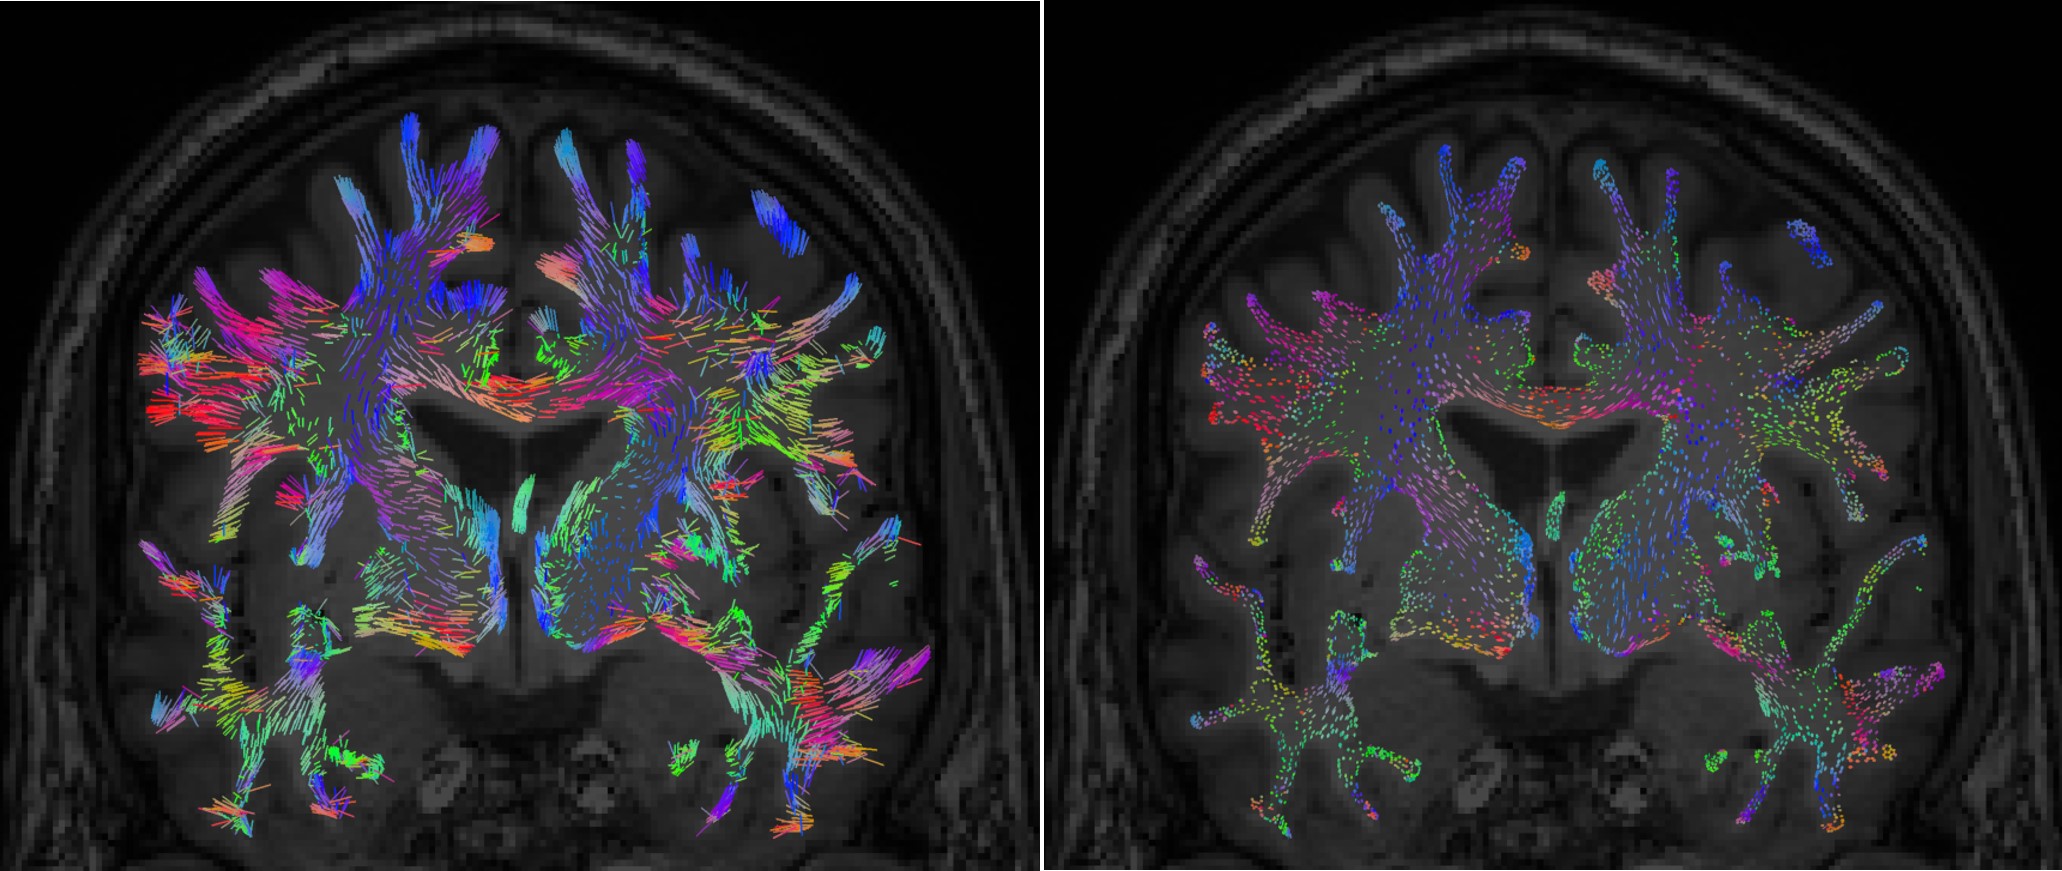
The size of the displayed tensors can be changed from the keyboard with the "Up" or "Down " arrows keys. You can also switch the display mode (from lines to ellipsoids to line or inversely) by using the shortcut "Shift + Space".
BEM head model
We will generate also the BEM surfaces for this subject and we will follow the same step as expect in this page. The obtained surfaces will be used later for the BEM source computation. Richt-click on the subject and then "Generate BEM surfaces", then keep the default options.
On the hard disc
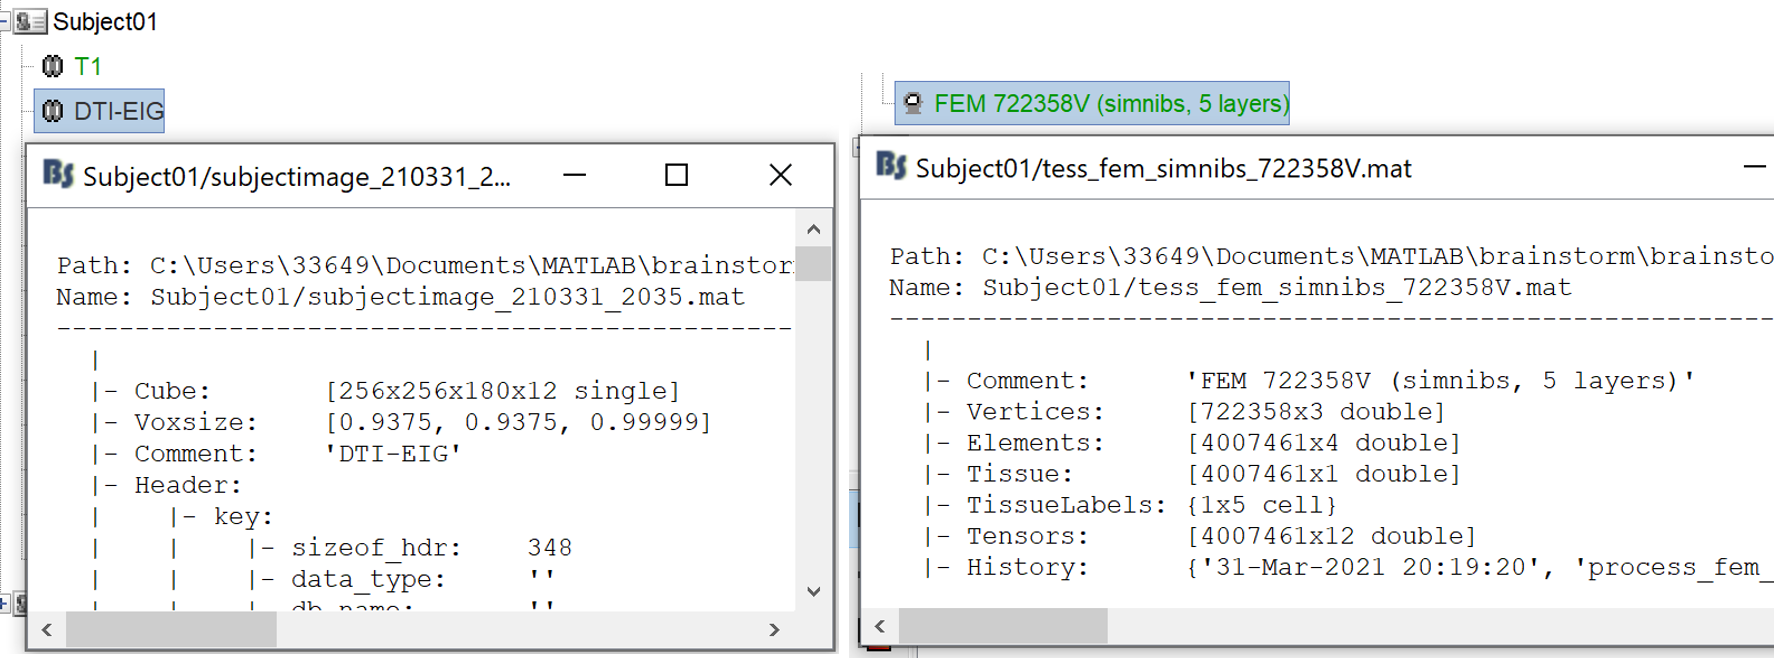
The "DTI-EIG" is saved structure as the Brainstorm MRI format, but it contains 12 values, from 1 to 9: components of the three eigenvectors, and from 10 to 12, the values of their norm to the eigenvalue.
The FEM mesh, as shown in the figure, contains the following fields
- Comment: 'FEM 722358V (simnibs, 5 layers)'
- Vertices: number of vertices x3, the coordinates of the nodes Elements: number of element x4, list of the connectivity between nodes
- Tissue: number of element x1, indexes or labels of the tissues, in Brainstorm the tissues are numbered from the inner to the outer layer (wm=1, gm=2, csf=3, skull=4, scalp=5)
TissueLabels: the labels of the tissues, {'white' 'gray' 'csf' 'skull' 'scalp'}
- Tensors: number of elements ×12 if tensors are computed, otherwise it's empty.
the 12 values are the eigenvalues and eigenvectors interpolated on each element of the mesh.
- History: history of the processes applied on this file
Access the recordings
Link the recordings
- Switch to the "functional data" view, the middle button in the toolbar above the database explorer.
Right-click on the subject folder > Review raw file:
- Select the file type: "MEG/EEG: Electa-Neuromag(*.fif)"
- Navigate to the downloaded folder and select the file "vp_median_rerve_R1_raw_tsss_anon.fif"
- Ignore the warning
- Apply the refine registration to the head points
- A figure is opened to show the current registration MRI/MEG. It is already quite good
- The new file "Link to raw file" lets you access directly the contents of the MEG/EEG recordings
- The "Neuromag channels(374)" contains the name of the channels and the position of the corresponding sensors (MEG/EEG)
Prepare the channel file
- The recordings contain signals coming from different types of electrodes:
- 306 MEG channels
- 64 EEG channels
- 2 EOG channels: EO1 and EO2
- 1 Stim channel that contain the stimulation signals
Refine the MRI registration
Right-click on the channel file > MRI registration > Edit... (EEG)
- The white points are the electrodes, the green points are the additional digitized head points. To display the label of the electrodes, click on the [LABEL] button in the toolbar. To see what the other buttons in the toolbar are doing and how to use them, leave your mouse over them for a few seconds and read the description.
Now try to manipulate the position of the EEG+MEG sensors using rotations and translations only (no "resize" or individual electrodes adjustments). The objective is to have all the points close to the surface and the three forehead points inside the little peaks on the surface (due to markers in the MRI).
The rotation+translation are going to be applied both to the EEG and the MEG sensors. After you are done with this solid registration part, you can click on the button "Project electrodes on scalp surface", it will help for the source modeling later. The green points (digitized) stay in place, the white points (electrodes) are now projected on the skin of the subject.
- If you feel like you didn't do this correctly, close the figure and cancel the modifications, then try again. It takes a few trials to get used to this rotation/translation interface.
Click on [OK] when done.
Answer YES to save the modifications.
Answer YES again to apply the solid transformation (rotation+translation) to the MEG sensors.
- Now all the electrodes are projected on the surface.
- (refine head with digitized points)
Read the stimulation information
Right-click on the "Link to raw file" > Stim> Display time series
- You can see the time series which contains the information of the electric stimulation. We are going to read this trigger channel as a list of events.
In the Record tab, menu File > Read events from channel.
Event channel = Stim
Option selected "TTL": detect peaks of 5V/12V on an analog channel.
- Do not select the option Accept zeros as trigger values
- Check that the peaks of the triggers channel have been correctly identified, then close this figure.
Pre-processing
Evaluate the recordings
- Drag and drop the "Link to raw file" into the Process1 list.
Select the process "Frequency > Power spectrum density", configure it as in the figure
- After the computation, double-click on the new PSD file to display it.
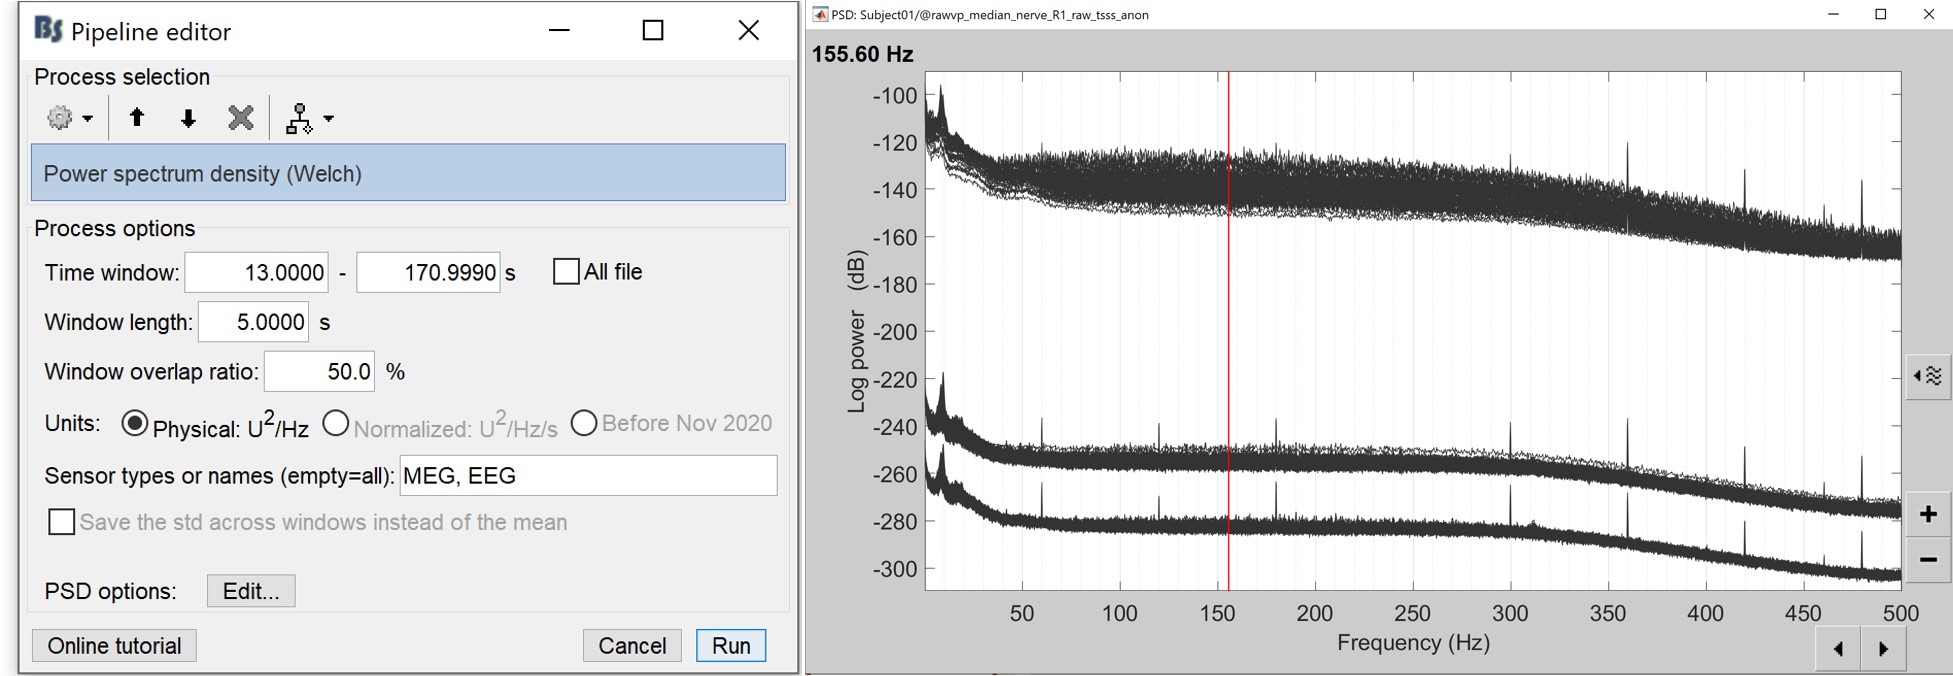
- The lines on the top represent the EEG electrodes, the lines at the bottom the MEG sensors(MAG and GRAD). If you want to get clearer plots, you can calculate separately the spectrum for the two types of sensors separately, by running twice the process "Power spectrum density" , once with sensor types = "MEG" and once with "EEG", instead of running in on both at the same time like we did.
- Observations (below 250Hz):
- Peak around 10Hz: Alpha waves from the subject's brain
- Peaks at 60Hz, 120Hz, 180Hz, 240Hz on EEG + MEG: Power lines (60Hz+harmonics)
- Most of the signal looks clean and no bad channel is observed
- If we review quickly the EEG and EOG signals, we notice that they are quite clean and no artifacts are observed. The experiment is well designed and the subject was not moving the eyes (blinks and slow movements), maybe because there was a fixation cross for this experiment. However, we will apply at least a high-pass filter to make the signals easier to process (we are not interested in very low frequencies in this experiment).
Frequency filters
- In Process1, select the "Link to raw file".
Select process Pre-process > Band-pass filter: Frequency=[0.5, 200]Hz, Sensors=MEG,EEG
Add processs Pre-process > Notch filter: Frequencies=[60 120 180]Hz, Sensors=MEG,EEG
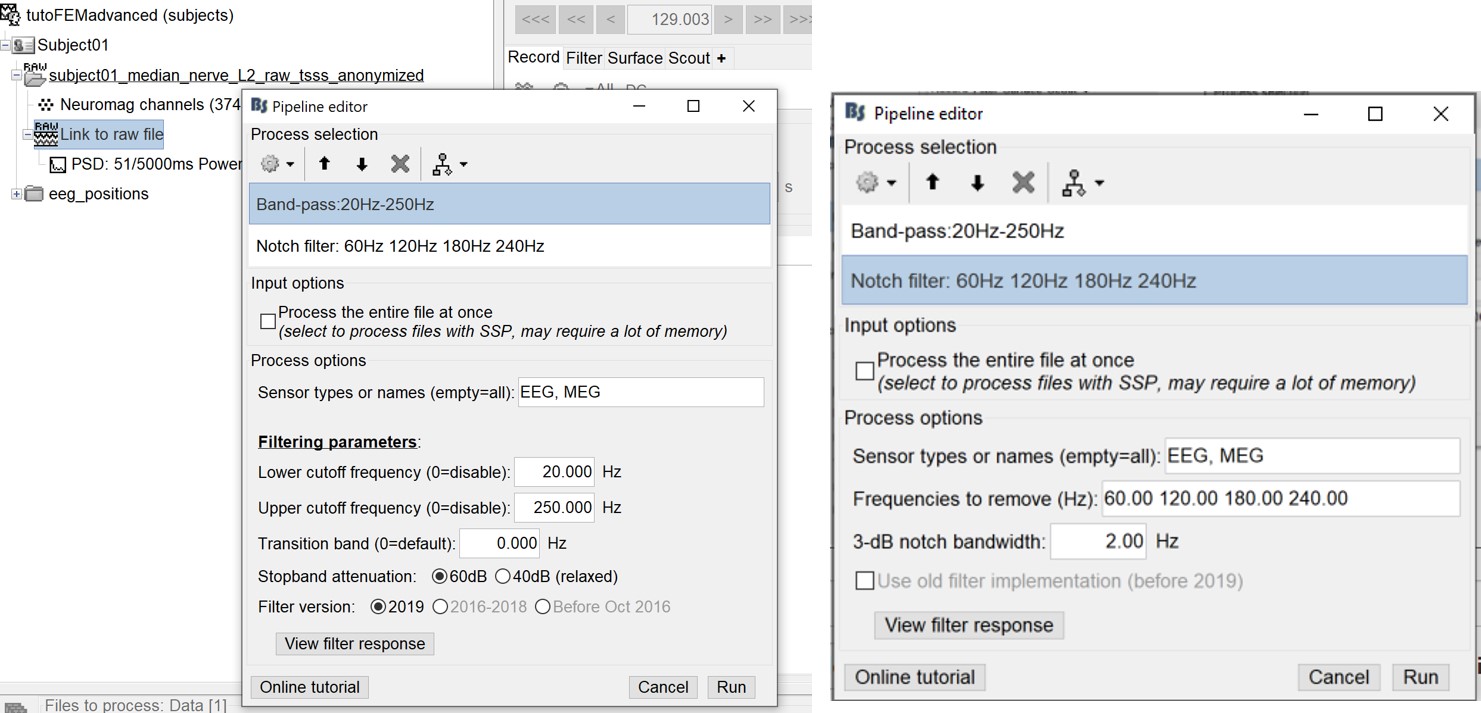
- In Process1, select the filtered file "Raw | Band | Notch".
Run the process "Frequency > Power spectrum density", with the same options as before. And compare with the previous figure. You may find that the power line frequency and its harmonics are removed.
Review the recordings
EEG: Average reference
Right-click on the filtered file "Raw|band|notch" > EEG > Display time series.
In the Record tab, menu Artifacts > Re-reference EEG > "AVERAGE".
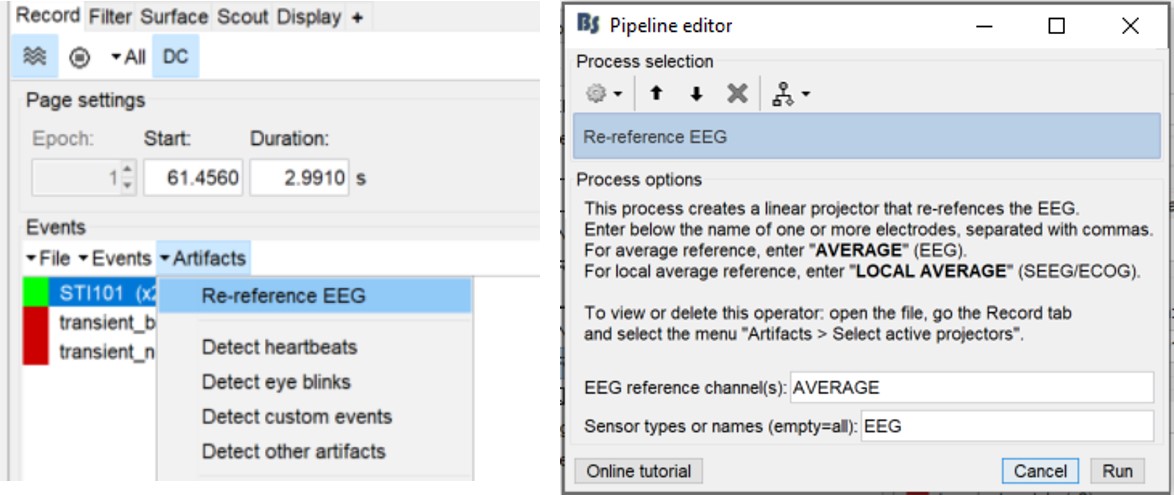
At the end, the window "Select active projectors" is open to show the new re-referencing projector. Just close this window. To get it back, use the menu Artifacts > Select active projectors.
Artifacts cleaning with ICA
Detect heartbeats and blinks
Right-click on the filtered file "Raw|band|notch" > EEG > Display time series.
In the Record tab, menu Artifacts > Detect heartbeat: channel ECG001
In the Record tab, menu Events > Detect eye blinks: channel EOG002
In the Record tab, menu Events > Remove simultaneous: "cardiac" / "blink" / 250ms.
- The heartbeats are correctly detected, but not the eye movements. There are not only blinks but also a lot of slow eye movements in these recordings. We will prefer an ICA approach, rather than a SSP decomposition which is more adapted to recordings with only clean blinks.
EEG: Heartbeats and eye movements
Right-click on the filtered file "Raw|band|notch" > EEG > Display time series.
In the Record tab, select the menu Artifacts > ICA components. Configure as illustrated below, make sur you do not select the option "Use existing SSP/ICA" (to ignore the average reference).
MEG: Heartbeats and eye movements
====> the data seems to be clean no artefcat detected using the ICA ===> already cleaned with tsss filters ? @ juan
Epoching and averaging
Import the recordings
In this experiment, the electric stimulation is sent with a frequency of 2Hz, meaning that the inter-stimulus interval is 500ms. We are going to import epochs of 400ms around the stimulation events.
Right-click on the filtered file "Raw|band|notch" > Import in database:
Check "Use events" and select "Stim01", Epoch time: [-50, 250] ms, Apply SSP/ICA.
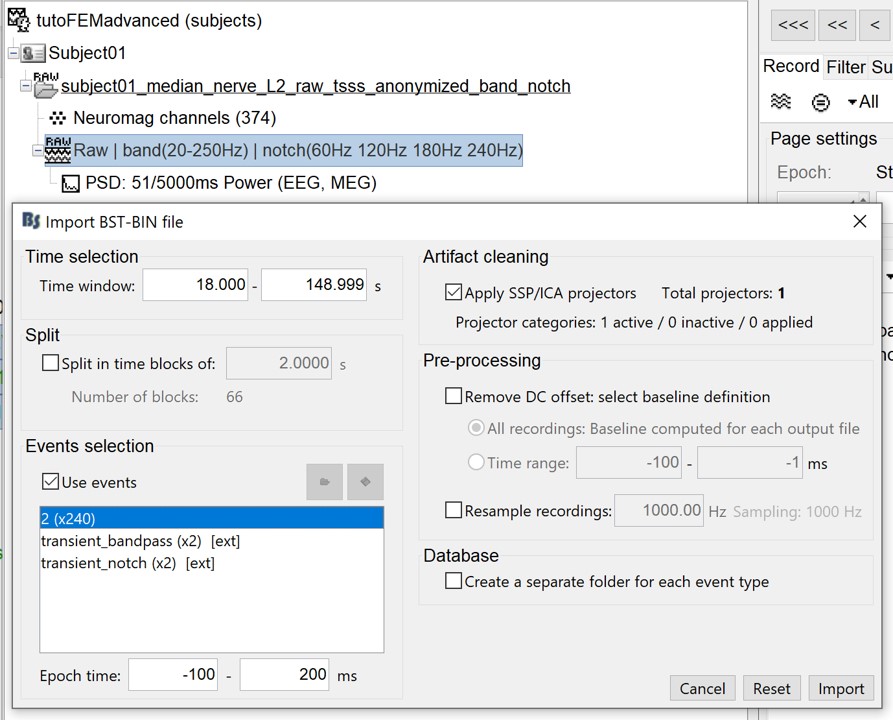
In the end, you are asked whether you want to ignore one epoch that is shorter than the others. This happens because the acquisition of the MEG signals was stopped less than 450ms after the last stimulus trigger was sent. Therefore, the last epoch cannot have the full [-50,250]ms time definition. This shorter epoch would prevent us from averaging all the trials easily. As we already have enough repetitions in this experiment, we can just ignore it.
Averaging
- Drag and drop all the Trigger01 trials to the Process1 tab.
Run the process Average > Average files: By trial group (folder average)
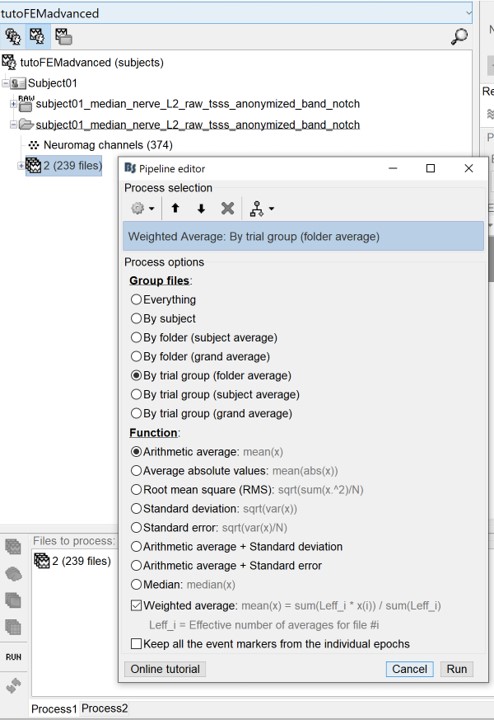
Review the average for the MEG and EEG as a topography plot -Right-click on the averaged signal -EEG (then MEG) > 2D disc
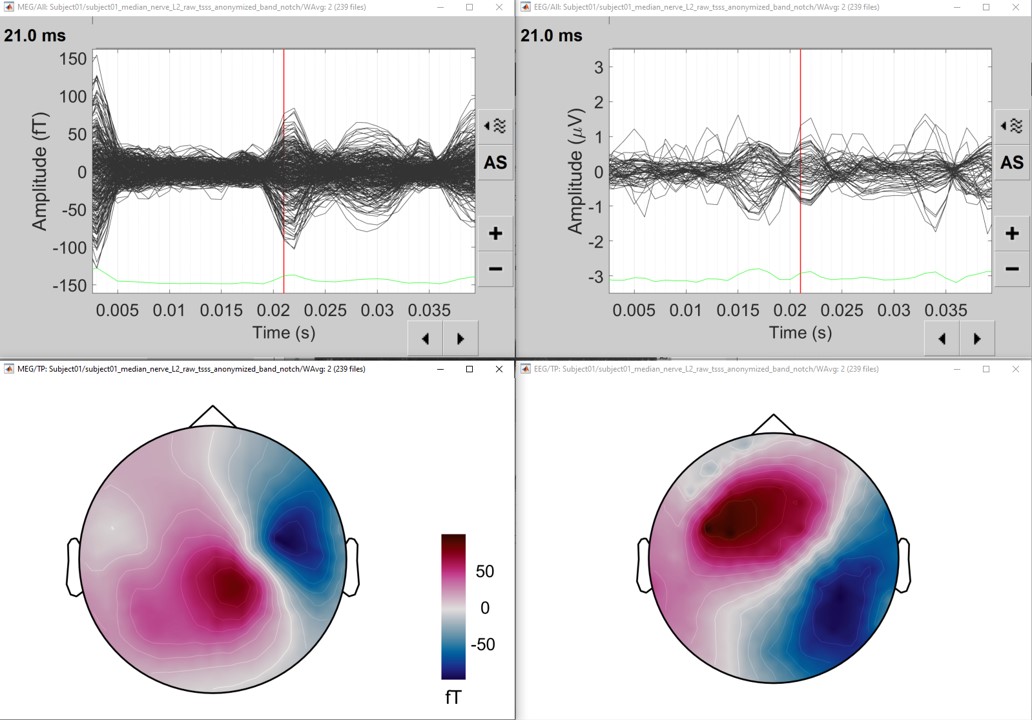
AT the selected time, an ERP is visible with a nice dipolar pattern on the sensors, both for the EEG and MEG.
Source estimation
Head model
Noise covariance matrix
Inverse model
Regions of interest
- Create two scouts S1 and S2 to represent the primary and secondary somatosensory cortex of the left hemisphere.