Montage editor
Authors: Francois Tadel, Martin Cousineau, Raymundo Cassani
Contents
The display of the time series figures can be configured using montages of sensors. The term montage in the Brainstorm interface can refer to a simple sub-selection of data channels, or a linear recombination of these channels (eg. average reference or other EEG re-referecing montage). The selection of channels was already introduced in the tutorials Continuous recordings and EEG and epilepsy. This page illustrates how to use the montage editor to create custom displays.
Pre-defined montages
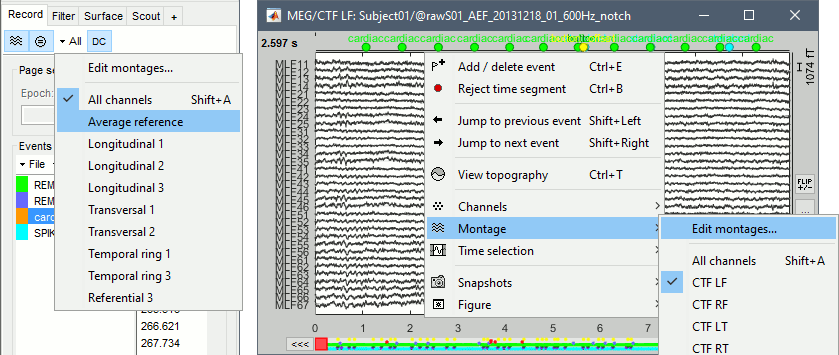
The interface offers some pre-defined montages for standard acquisition systems: MEG (Elekta-Neuromag, CTF, Yokogawa, 4D), EEG (10-20 and 10-10 caps) and NIRS (overlay of multiple wavelengths). The montage menu is accessible from the Record tab or with the popup menu on the time series figures.
The keyboard shortcuts (Shift+A, Shift+B, etc), allow to jump quickly to a different montage (see Assigning a keyboard shortcut). To display a second montage on the same recordings, open again the same file (right-click > Display time) and change the montage of the second window, as illustrated in the tutorial EEG and epilepsy.
Edit montages
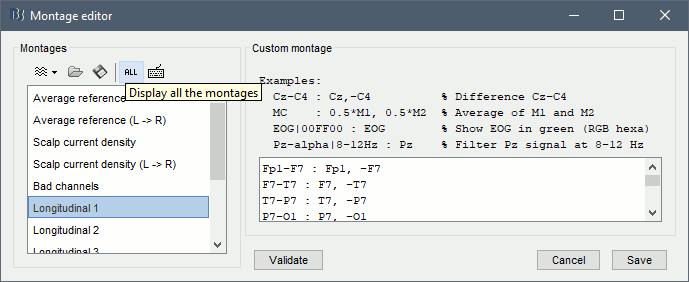
To edit/create your own montages, use the menu "Edit montages". By default, it shows only the montages that are relevant to the type of recordings you are currently looking at (in the example below: EEG 10-20). To see all the available options, click on the button "All".
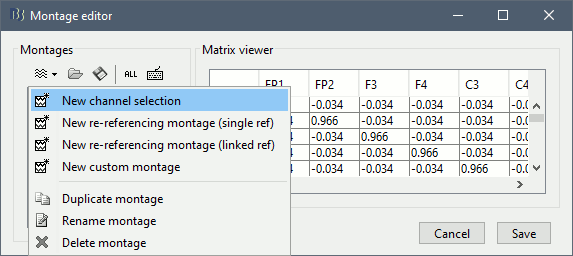
To create a new montage, click on the drop-down menu in the toolbar, the select the appropriate option (detailed in the following sections).
Channel selection
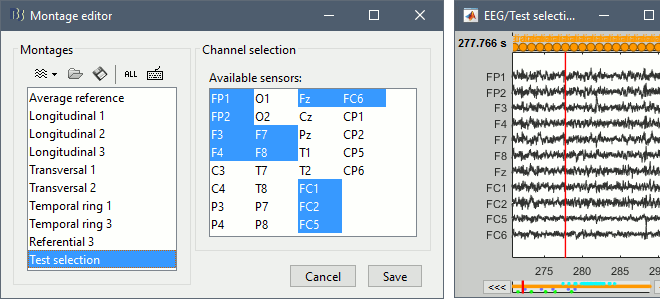
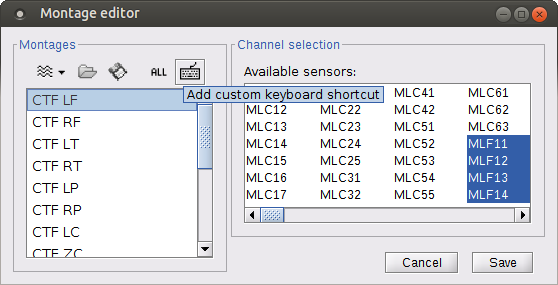
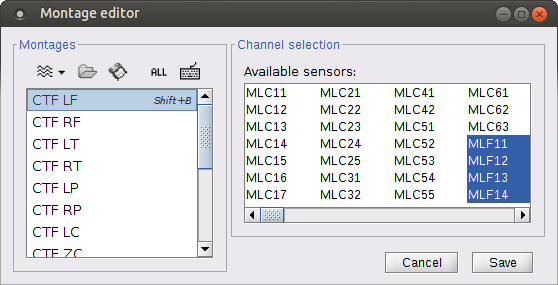
To create a new selection of data channels, select the menu New channel selection, enter a name for your montage, then select the channels you want to display in the list of available channels (hold the Shift or Ctrl/Command key to select multiple channels).
In the figure, the channels are displayed in the same order as they are defined in the channel file. If you want to change the display order of the channels, you need to create a custom montage.
Custom montage
All the other types of montages that you can edit are custom montages. They let you define line by line what to display in the time series figures. A montage is represented as a short text file, with one line of text per signal to display. A signal is a linear combination of one or more channels of data, which can be filtered in a specific frequency band and displayed in a specific color. The generic syntax to represent the sum of N channels chi with individual weights wi is:
label|color|filter : w1*ch1, w2*ch2, ..., wN*chN
The various display options can be indicated in any order or ignored:
Color: Indicated in hexadecimal notation RRGGBB, use any HTML color picker for help.
Examples: 000000 is black, FF00000 is red, 00FF00 is green, 0000FF is blue, A0A0A0 is a light grey.Filter: Filters the signal in a given frequency band before displaying it. Defined with the syntax "XX-YYHz" where XX is the lower cutoff frequency and YY the higher cutoff frequency. Set XX to 0 for a low-pass filter, or YY to 0 for a high-pass filter.
Examples: "8-10Hz" is a band-pass filter in the alpha range, "0-30Hz" is a low-pass filter at 30Hz, "1-0Hz" is a high-pass filter at 1Hz.Overlay: Give the same label to two signals and they will be displayed on top of each other.
Validate: Click on the button "Validate" to make sure the syntax of your montage is correct.
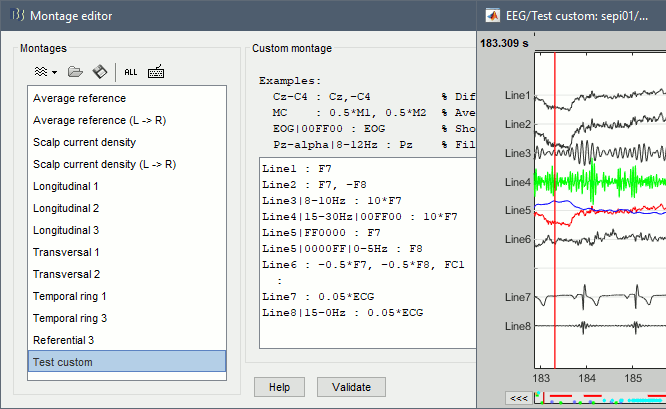
The screen capture below illustrates a few examples.
Line1: Channel F7.
Line2: Subtraction (F7 - F8).
Line3: Channel F7 filtered between 8 and 12 Hz, with a scaling factor x10
Line4: Channel F7 filtered between 15 and 30 Hz, displayed in green, with a scaling factor x10
Line5: Channel F7 in red and F8 in blue (overlay lines by giving them the same label).
Line6: Computes "FC1 - 0.5*F7 - 0.5*F8" (typical syntax for a linked re-referencing).
Separator: A line that contains only ":"
Line7: Channel ECG, with a scaling factor 0.05 (so that it can be displayed in the same figure).
Line8: Same as line7 with a high-pass filter at 15Hz.
Re-referencing montage
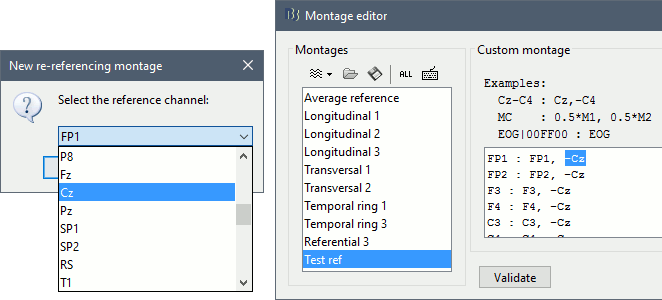
The menus New re-referencing montage (single ref) or (linked ref) are shortcuts to create custom montages that subtract the values of one or two channels to all the other channels.
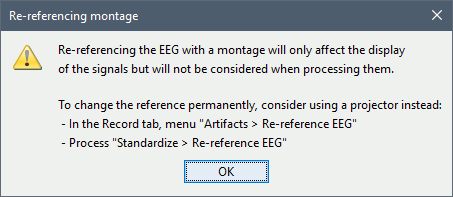
Every time you select one of these menus, you get the warning below. The montages are not applied to the recordings, they are for visualization only. To re-reference correctly your EEG recordings, use the process "Standardize > Re-reference EEG".
Average reference
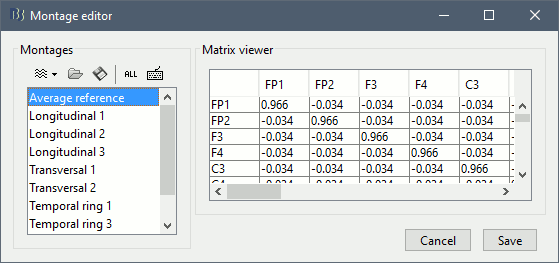
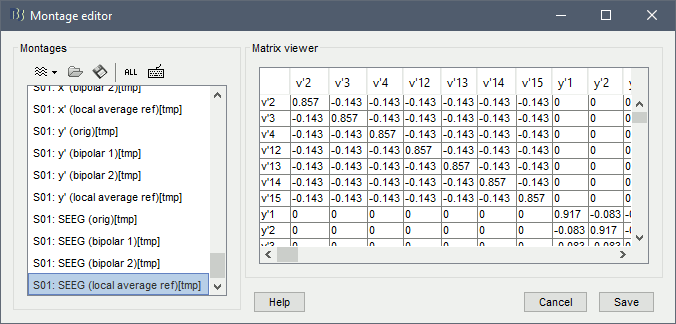
A special type of montage is available for re-referencing the EEG/SEEG/ECoG recordings to an average reference. It subtracts from each channel the average of all the channels. It cannot be edited and is displayed as a matrix with (1-1/Nchan) on the diagonal and (-1/(Nchan-1)) everywhere else.
For ECoG and sEEG recordings, another option is to compute the average reference separately for each group of contacts, typically each grid/strip or depth electrode. The groups of channels are defined with the field Group in the channel file, and can be edited with the channel editor (right-click on the channel file > Edit channel file). This menu is available as the last dynamic montage in the list: SubjectName: SEEG (local average ref).
Infinite reference (REST)
For EEG signals, the reference electrode standardization technique (REST) aka Infinity reference is now available. This re-referencing method transforms EEG data from any arbitrary reference (e.g., linked mastoids, average reference) to an equivalent reference at infinity, which is theoretically reference-free. The approach was first introduced by [[|Yao (2001)]]. This is achieved this by:
Modelling the scalp EEG as arising from distributed equivalent sources within a realistic head model.
- Computing the lead field matrix for both the actual reference used during recording and the idealized “infinity” reference.
- Applying a linear transformation to convert the recorded potentials into an estimate of potentials referenced to infinity.
As it can be seen in the Step1, a head model is required before using REST as re-referencing method. If there is not head model, REST falls-back into average reference.

Add reference channel back
In some cases EEG recordings are referenced to a specific sensor, e.g., Cz, this implies that the recordings do not contain a time series for this channel as it is 0 V for any moment. For some applications, e.g., re-reference the EEG recordings to average or infinite reference, it is necessary to retrieve the reference channel. This can be achieved using the add-reference-channel-back montage on the data. As this is a montage, it is not applied to the recordings, they are for visualization only. To create a copy of the EEG data with the reference channel added back EEG recordings, use the process "Standardize > Apply montage".

Scalp current density
Another special type of montage is available for EEG only: Scalp Current Density (SCD). This commonly used technique applies a spatial Laplacian transformation to the EEG recordings, with the purpose of cleaning the signals or sharpening the topography maps. You can refer to the rich literature in this domain, and maybe start with this introduction video from Mike X Cohen:
In the example below, see how this montage can enhance the visual detection of spikes in the EEG /Epilepsy tutorial. Top=Average reference, Bottom=Scalp Current Density.


The implementation used here is the one developed by Robert Oostenveld in FieldTrip, the option 'finite' in ft_scalpcurrentdensity.m, which uses the function lapcal.m for the computation of the Laplacian.
Apply a montage to the recordings
Standardize > Re-reference EEG: Only available for continuous recordings, see EEG and Epilepsy.
Standardize > Apply montage: For continuous and imported epochs (usually not recommended for imported epochs).
Assigning a keyboard shortcut
You can easily switch between montages directly from figures by assigning a keyboard shortcut to a montage (Shift+A to Shift+Z). Shift + A is reserved for All channels, but you are free to assign any other letter to the montage of your choice. In order to do so, select your montage of interest in the Montage editor and click on the keyboard icon.
You will then be prompted to enter a letter key (B to Z).
If a valid letter is entered, the shortcut will be automatically be saved and appear next to the chosen montage. If another montage had the same shortcut, it will be overwritten.
Additional documentation
Related tutorials
Articles
Yao, D. (2001). A method to standardize a reference of scalp EEG recordings to a point at infinity. Physiological Measurement, 22(4), 693–711..
Forum discussions
