Montage editor
Authors: Francois Tadel
Contents
The display of the time series figures can be configured using montages of sensors. The term montage in the Brainstorm interface can refer to a simple sub-selection of data channels, or a linear recombination of these channels (eg. average reference or other EEG re-referecing montage). The selection of channels was already introduced in the tutorials Continuous recordings and EEG and epilepsy. This page illustrates how to use the montage editor to create custom displays.
Pre-defined montages
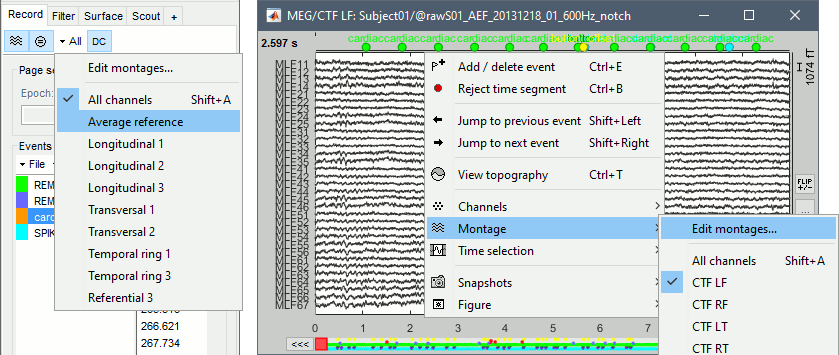
The interface offers some pre-defined montages for standard acquisition systems: MEG (Elekta-Neuromag, CTF, Yokogawa, 4D), EEG (10-20 and 10-10 caps) and NIRS (overlay of multiple wavelengths). The montage menu is accessible from the Record tab or with the popup menu on the time series figures.
The keyboard shortcuts (Shift+A, Shift+B, etc), allow to jump quickly to a different montage. To display a second montage on the same recordings, open again the same file (right-click > Display time) and change the montage of the second window, as illustrated in the tutorial EEG and epilepsy.
Edit montages
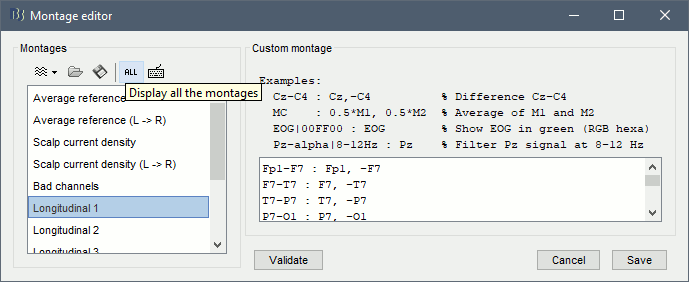
To edit/create your own montages, use the menu "Edit montages". By default, it shows only the montages that are relevant to the type of recordings you are currently looking at (in the example below: EEG 10-20). To see all the available options, click on the button "All".
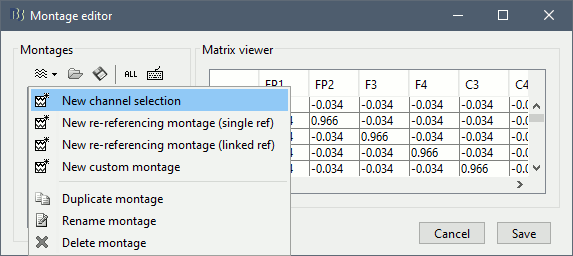
To create a new montage, click on the drop-down menu in the toolbar, the select the appropriate option (detailed in the following sections).
Channel selection
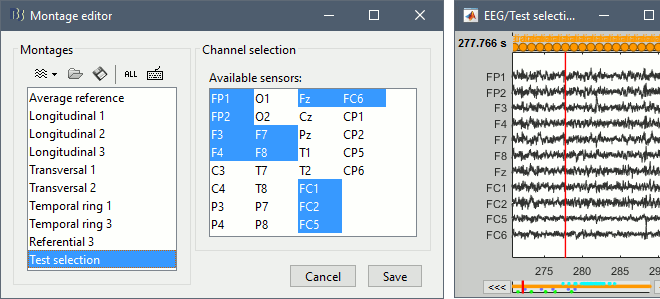
To create a new selection of data channels, select the menu New channel selection, enter a name for your montage, then select the list of channels you want to display in the list of available channels (hold the Shift or Ctrl/Command key to select multiple channels).
In the figure, the channels are displayed in the same order as they are defined in the channel file. If you want to change the display order of the channels, you need to create a custom montage.
Custom montage
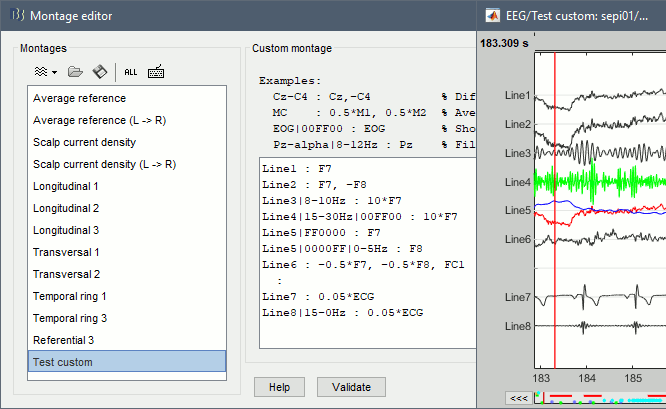
All the other types of montages that you can edit are custom montages. They let you define line by line what to display in the time series figures. A montage is represented as a short text file, with one line of text per signal to display. A signal is a linear combination of one or more channels of data. The generic syntax of a line to represent the sum of N channels chi with individual weights wi is:
label|color : w1*ch1, w2*ch2, ..., wN*chN
The screen capture below illustrates a few examples.
- Line1:
Setting the color
Overlay channels
Re-referencing montage
To re-reference the
Average reference
A special type of montage is available for re-referecing the EEG/SEEG/ECoG recordings to an average reference.
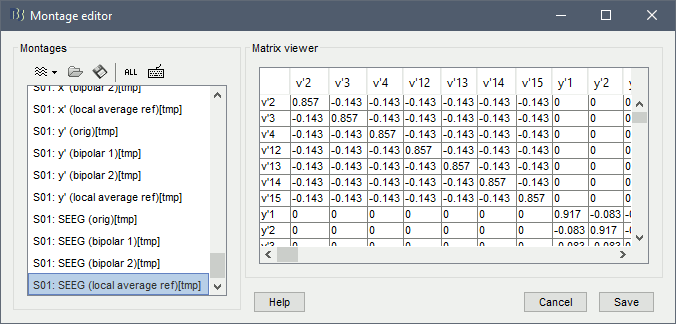
Apply a montage to the recordings
The montage selection is only a visualization option, it never modifies the recordings. If you want to apply a specific montage to the recordings, you need to call the process Standardize > Re-reference EEG (see EEG and Epilepsy) or the process Standardize > Apply montage (only available for imported epochs).
