Tutorial 25: Statistics
[TUTORIAL UNDER DEVELOPMENT: NOT READY FOR PUBLIC USE]
Authors: Francois Tadel, Dimitrios Pantazis, Elizabeth Bock, Sylvain Baillet
Until now we have been computing measures of the brain activity in time or time-frequency domain. We were able to observe clear effects or slight tendencies, but what we were observing was always dependent on an arbitrary amplitude threshold or on the configuration of the colormap. With appropriate statistical tests, we can go beyond these empirical observations and assess what are the significant effects in a more formal way.
We are typically interested in comparing different groups of samples. We want to know what is significantly different in the brain responses of two experimental conditions or two groups of subjects. So we will be essentially estimating differences and testing if these differences are significantly different from zero.
Contents
Difference deviant-standard
In this auditory oddball experiment, we can test for the significant differences between the brain response to the deviant beeps and the standard beeps, time sample by time sample.
Before running complicated statistical tests that will take weeks of computation, you can start by checking what the difference of the average responses looks like. If in this difference you observe obvious effects that are clearly not what you are expecting, it's not worth moving forward with finer analysis: either the data is not clean enough or your initial hypothesis is wrong.
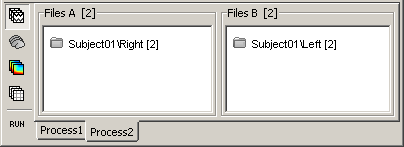
We are going to use the Process2 tab, at the bottom of the Brainstorm figure. It works exactly like the Process1 tab but with two lists of input files, referred to as FilesA (left) and FilesB (right).
In Process2, drag and drop the non-normalized deviant average on the left (FilesA) and the non-normalized standard average on the right (FilesB).
Run the process "Difference > Difference A-B".
Select the option "Use absolute values", which will convert the unconstrained source maps (three dipoles at each cortex location) into a flat cortical map by taking the norm of the three dipole orientations before computing the difference.
![[ATTACH] [ATTACH]](/moin_static1911/brainstorm1/img/attach.png)
Rename the new file in "Deviant-Standard", double-click on it and explore it in time.
![[ATTACH] [ATTACH]](/moin_static1911/brainstorm1/img/attach.png)
- We are looking at the difference (Deviant-Standard) so positive/red regions indicate higher activity levels for the deviant beeps, and negative/blue regions higher activity for the standard beeps.
Before 50ms: The motor activity in the deviant is probably due to the previous stims.
P50: Maybe a stronger response in the primary auditory cortex for the standard condition.
MMN (125ms): Stronger response for the deviant (left temporal, inferior frontal).
150ms: Stronger response in the auditory system for the standard condition.
175ms: Stronger response in the motor regions for the standard condition (motor inihibition).
After 200ms: Stronger response in the deviant condition.
Difference of means
Another process can compute the average and the difference at the same time. We are going to compute the difference of all the trials from both runs at the sensor level. This is usually not recommended because the subject might have moved between the runs. Averaging the recordings across runs is not accurate but can give a good first approximation, in order to make sure we are on the right tracks.
In Process2, select all the deviant trials (Files A) and all the standard trials (Files B).
Run the process "Test > Difference of means", select the option "Arithmetic average".
![[ATTACH] [ATTACH]](/moin_static1911/brainstorm1/img/attach.png)
Rename the new file in "Deviant-Standard", double-click on it to display it. The difference deviant-standard does not show anymore the early responses (P50, P100) but emphasizes the difference in the later process (MMN/P200 and P300).
![[ATTACH] [ATTACH]](/moin_static1911/brainstorm1/img/attach.png)
Parametric Student's t-test
Using a t-test instead of the difference of the two averages, we can reproduce similar results but with a significance level attached to each value.
- In the Process2 tab, select the following files:
Files A: All the deviant trials, with the [Process sources] button selected.
Files B: All the standard trials, with the [Process sources] button selected.
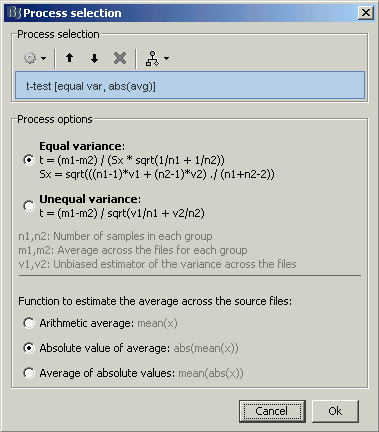
Run the process "Test > Student's t-test", Equal variance, Average of absolute value.
We have to select this last option if we want to do the test on the norm of the three dipole orientations for unconstrained sources. The second option (absolute value of average) is better indicated for constrained source maps, but here it would return one value per orientation, which is then difficult to interpet.
![[ATTACH] [ATTACH]](/moin_static1911/brainstorm1/img/attach.png)
Double-click on it for displaying it. With the new tab "Stat" you can control the p-value threshold and the correction you want to apply for multiple comparisons.
![[ATTACH] [ATTACH]](/moin_static1911/brainstorm1/img/attach.png)
Set the options in the Stat tab: p-value threshold: 0.01, Multiple comparisons: Uncorrected
![[ATTACH] [ATTACH]](/moin_static1911/brainstorm1/img/attach.png)
From CTF
This tutorial introduces the Process2 tab, which is mainly used to test two different sets of data. This tab works the same way as the Process1 tab, except that you have to define two sets of files instead of one. This tool will be presented very briefly now, and the results will not have any scientific meaning, because the protocol TutorialCTF do not contain enough data to perform any interesting statistical test.
Binary processes
The first type of processes you can find in the Process2 panel are binary file-by-file operations. You define a list of files A and a list of files B, with the same number of files in both lists, and you run a process that is going to create one output file for each couple of files (Ai, Bi). The only two process of that type that are available now are: a difference and an average. Let's try the difference, just for illustrating the interface.
Files selection
Drag and drop the Right condition in "Files A" list, and the Left condition in "Files B" list. Select the "recordings" button. Click on Run.
Process selection
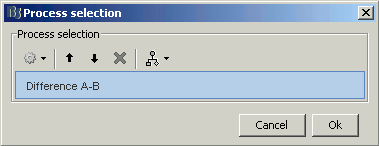
Select process "Other > Difference A - B" to compute a "file by file" difference between files A and files B. Click on Ok to run the process.
Results
There where 2 x 2 files in input, there are 2 files in output, in a newly created condition "Right - Left".
Now delete this condition before going any further.
Tests
We do not have enough data to illustrate these tests, it will be done soon in another tutorial, based on single trials instead of average recordings. Its works exactly the same way with many files or many subjects: put all the files from condition A in the first list, and all the files from condition B in second list, no matter if they belong to the same subject or not. Then select your process.
In the multiple subjects case, the exploration mode "Functional data (by condition)" is usually useful to select a given condition for all the subjects. To switch to this mode, click on the third button on top of the database explorer in the main window.
Difference of mean
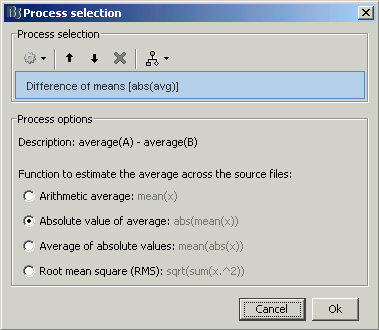
Calculates separately the average of files A and the average of files B, and the do the subtraction average(A) - average(B).
- It gives cortical maps that are similar to the t-tests (following processes), but without the measure of significance of the results.
If there is only one file in each set, it's going to perform the same operation as "Other > Difference A-B"
- In the case of sources, there is an extra option to define what type of "Average" function you want to use.
Student's t-test
Get the significant differences between two conditions.
Within one subject: Test a set of individual trials of condition A vs. a set of trials of condition B.
Across subjects: Test a set of subjects for condition A vs. a set of subjects for condition B. Each file (Subject #i, Condition X) is an average response computed across many trials.
- Same thing as for the difference of means: in the case of source files, there is an extra option to define how to compute the average across the trials.
Student's t-test (paired)
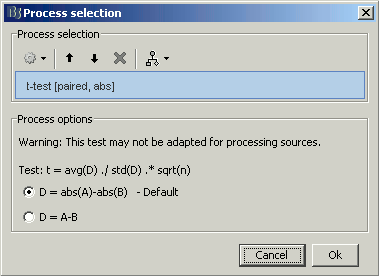
For the two previous processes, the number of files in sets A and B do not have to be the same. This one requires to have the same number of samples on both sides. It creates dynamically a new set of files C, where file Ci = (Ai - Bi), and then tests if this set C is equal to zero.
FieldTrip: Cluster-based correction
Export to SPM
Brainstorm does not offer a very large variety of statistical tests. However, it is easy to export your source results and process them with a specialized program. Some examples are illustrated in the advanced tutorials:
Export source maps to SPM8 (volume)
Export source maps to SPM12 (surface)
On the hard drive
References
Maris E, Oostendveld R, Nonparametric statistical testing of EEG- and MEG-data, 2007
Pantazis D, Nichols TE, Baillet S, Leahy RM. A comparison of random field theory and permutation methods for the statistical analysis of MEG data, 2005
Additional discussions on the forum
Forum: Multiple comparisons: http://neuroimage.usc.edu/forums/showthread.php?1297
Forum: Cluster neighborhoods: http://neuroimage.usc.edu/forums/showthread.php?2132
Delete all your experiments
Before moving to the next tutorial, delete all the statistic results you computed in this tutorial. It will make it the database structure less confusing for the following tutorials.
