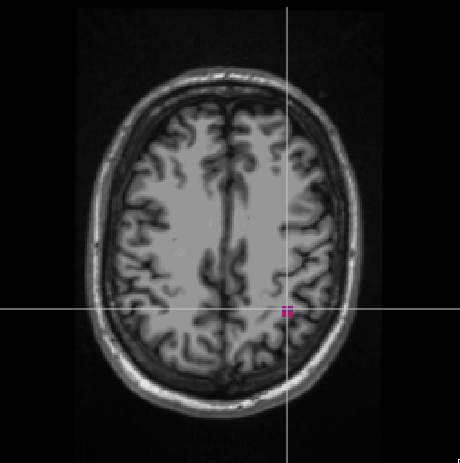
We solved the forward model using MRI volume, and we select the below vertices:
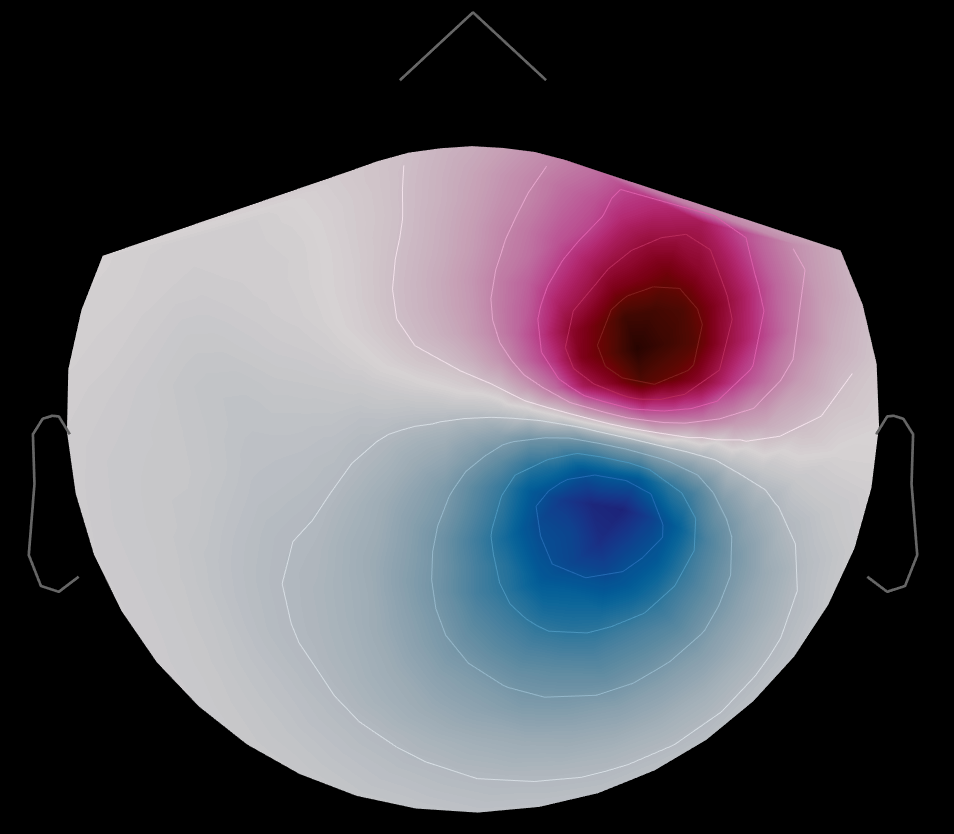
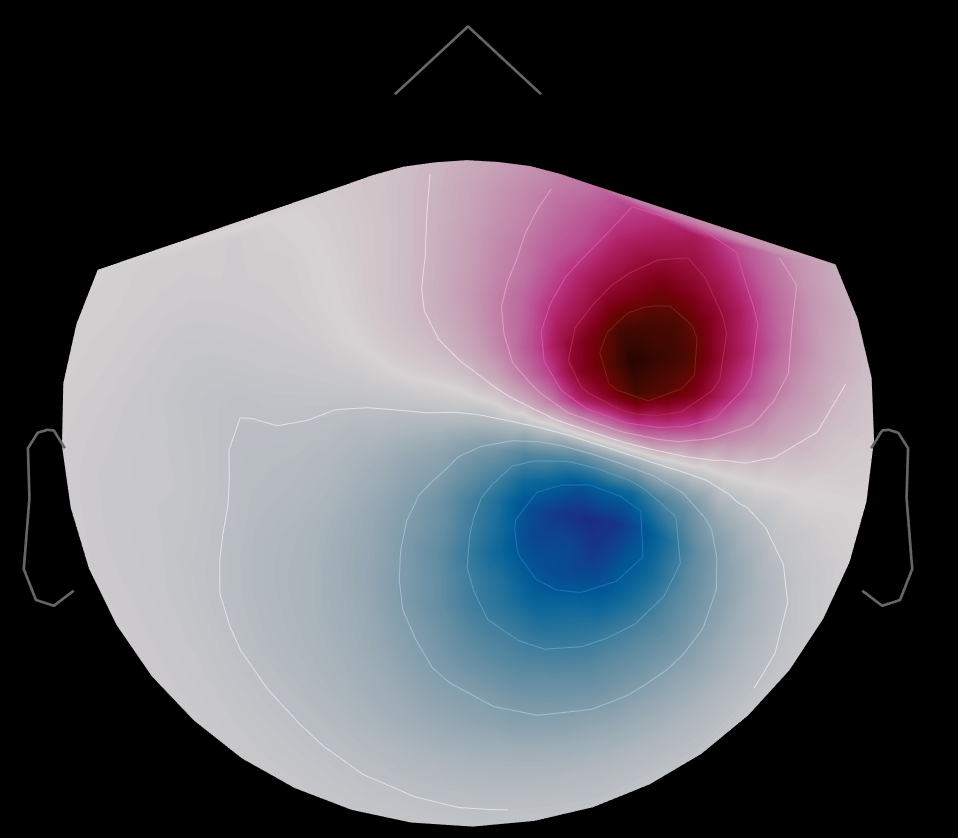
Then we simulate with several dipole orientation and display the corresponding 2D map:
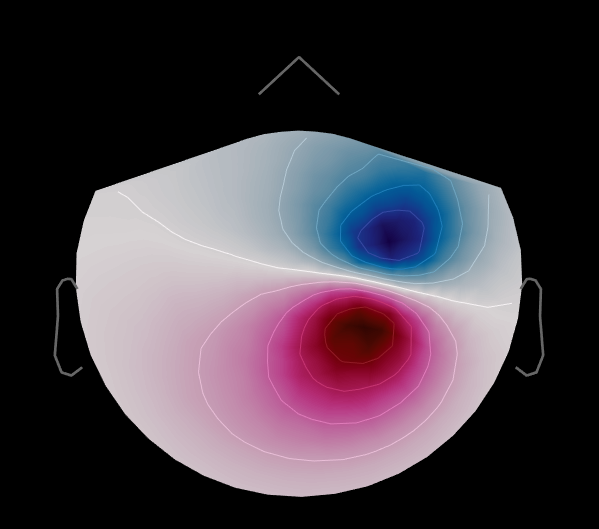
We modify the orientation using: source.ImageGridAmp(16966:16968,1)=[0;0;-1];
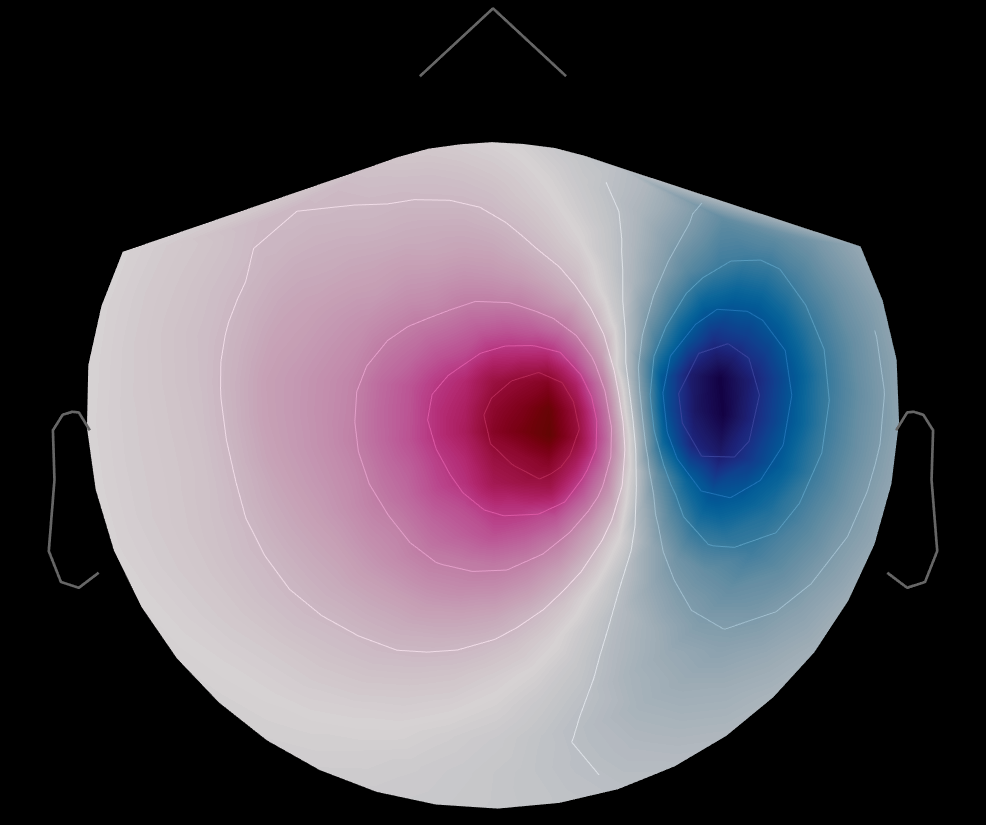
2D map are those expected for two tanfential example;
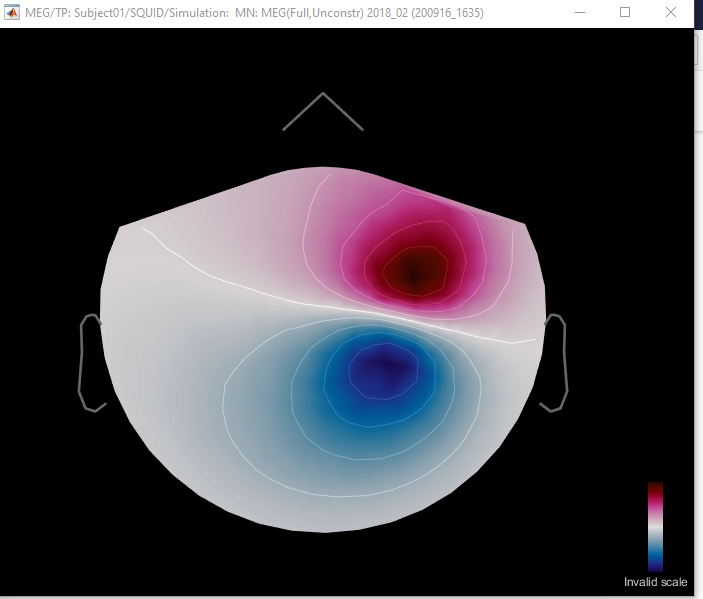
For the radial or near radial example we should expect to get only few magnetic field with one spot topography, I do not understand the 2D map that I obtained. Thanks for your explanation;
Radial means the dipole is oriented along a radius of the sphere fitted to the head. It is not necessarily along the Z direction, as you show here. Also, make sure you visualize the colorscales as the amplitudes are expected to be dramatically different between orientations.
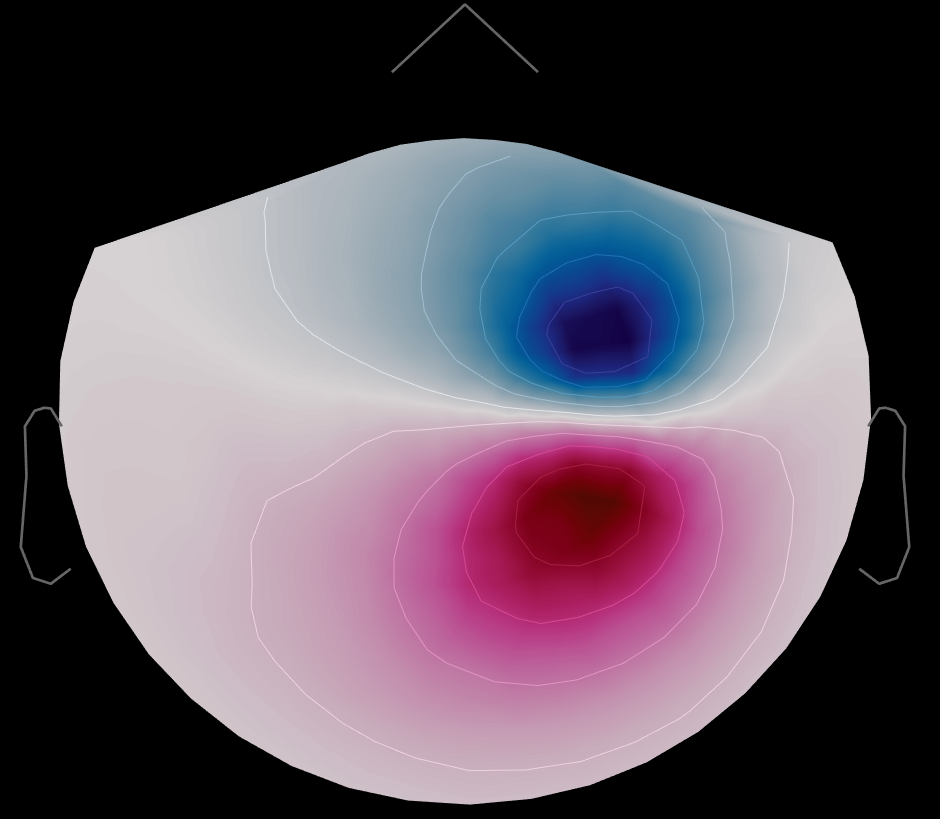
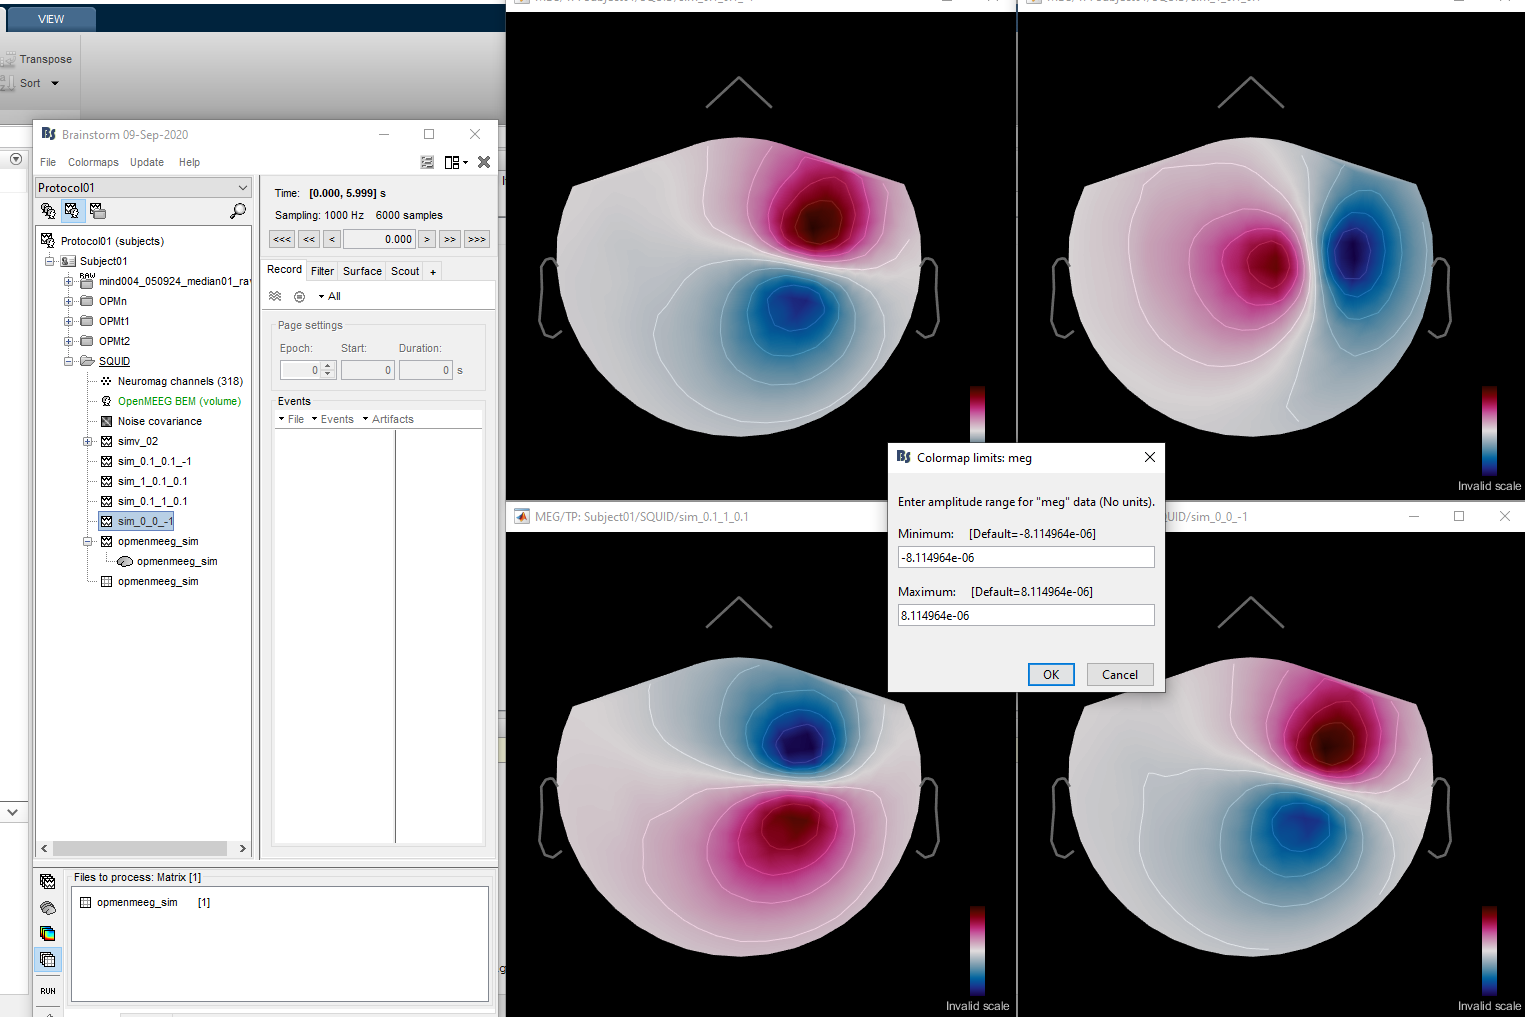
We did another simulation, we varied the z axis from -1 to 1 in 20 step and we just noticed the flipping over the 2D map, where I expected to see 1 spot topography at a certain time
Thanks - As I mentioned, the radial direction might not be the z-axis. It depends on the respective locations of the source and of the center of the sphere. Note that if you used the overlapping-sphere head model, there is no true radial source.
I think that I found a solution, the issue was I should not put zero in Amplitude (for any of the axis of dipole), now it works, but thank you very much Sylvain for you answer,
You should also pay attention to the range of values you use.
With the MEG sensors values you show here (in the range of 1e-6), the color scale is invalid, and you may have other display issues for your MEG topographies.
I'd recommend you stick with realistic values for your source simulations, in order to obtain MEG values in the range of 1e-12 (fT)