Dear Francois,
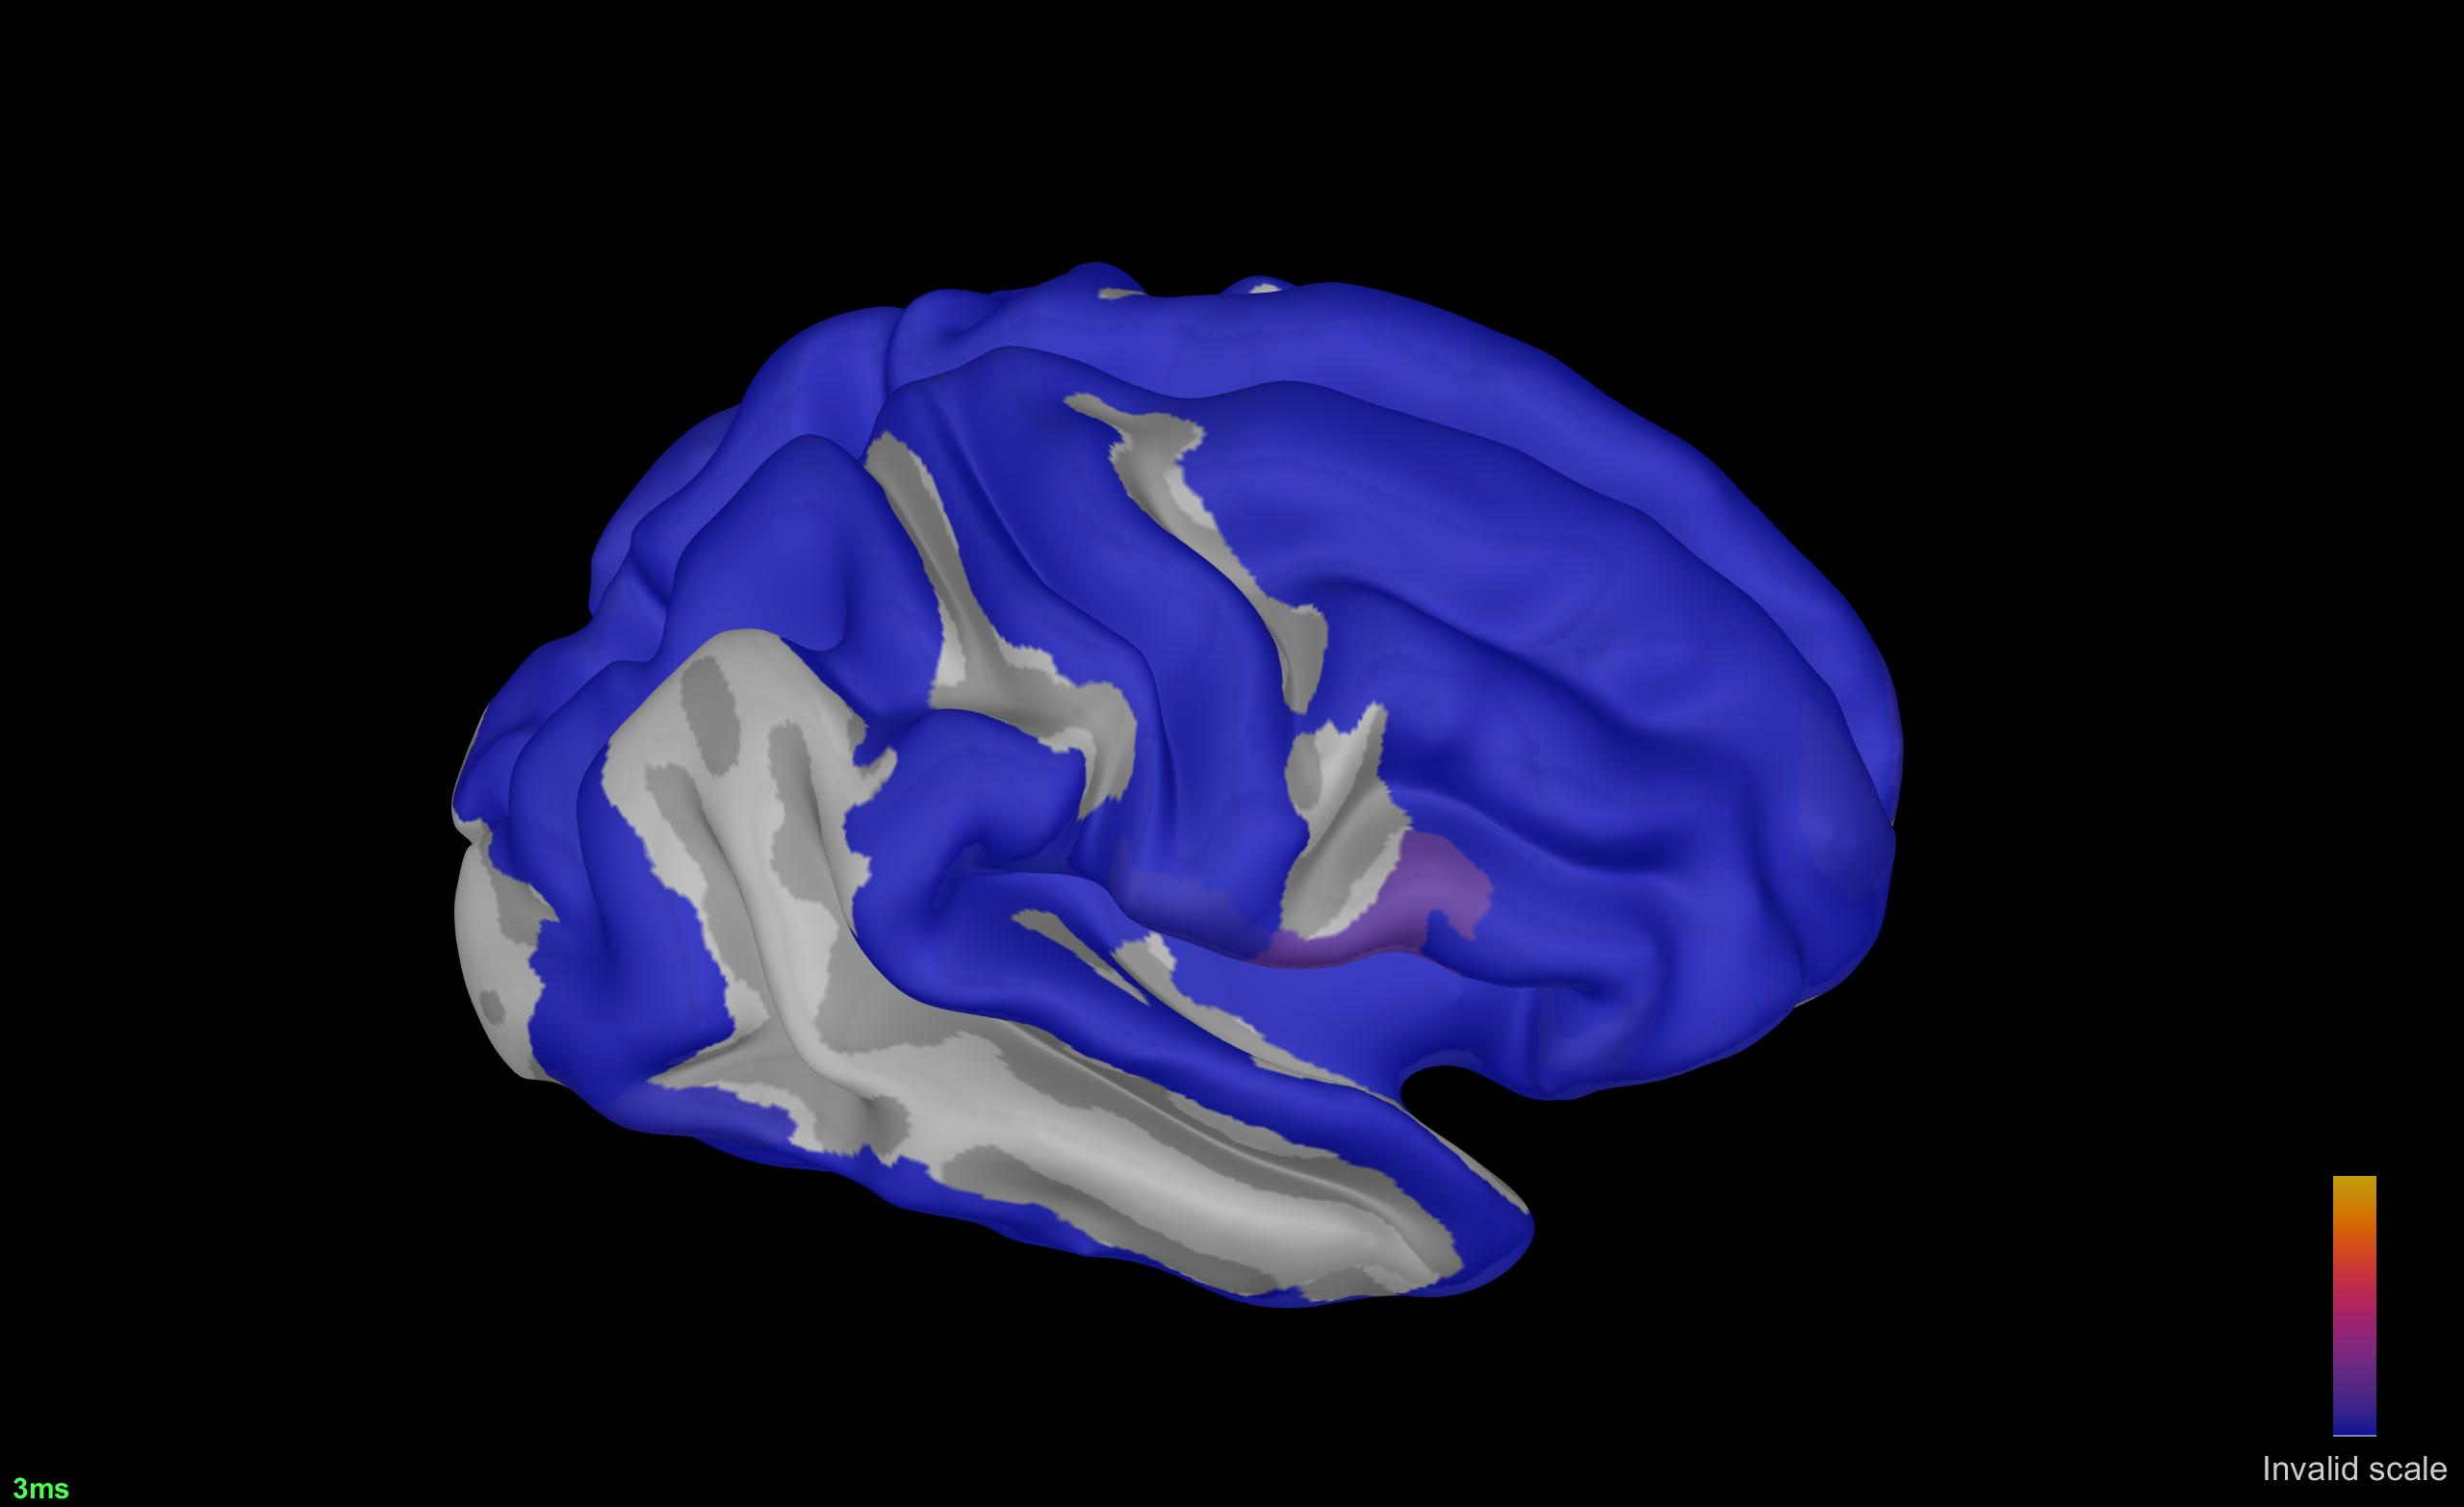
Thank you for the code. Regarding the nxn connectome matrix taken as a nXt (scouts X time) by brainstorm, it worked, see attached. I plan writing up a custom process to take out the head /source modeling part. The view attached is with the scout parcellation selected but not displayed, not to confound the colorscale (together, parcels and simulations plotted together do not look good). The one issue is the colorbar, which shows an invalid scale; I assume this does not include mix in the original scout/annot colormap with the simulation color code. How one could fix the 'invalid' scale issue. Also, I assume brainstorm reads off the min and mx source intensity automatically, and those are the min and max connection strengths at time t (one matrix column) filtered through the source imaging/head model etc. If that is correct, how one can change the min colormap value displayed to threshold the matrix display (fewer or mode colored (>0) parcels. Also, is there a way to change the colormap for a linear one to one where variation in gradient can be controlled? One can always adjust the input matrix for display, I wanted to know the range of possibilities. Thank you, Octavian.