Hi Francois
Thank you for your response.
I did do a paired permutation t-test. I forgot to mention that.
I only have 9 participants - could this be part of the issue? (Unfortunately I had to exclude a number of participants who didn't follow the experiment instructions properly, putting me below the threshold for sufficient participants, so I am just using this data as pilot data with which to learn the ropes.) This is why I didn't activate multiple comparisons - just to see.
I have re-tried the analysis a few times, but not right back to making the individual trial PSD files from the sensor data yet.
However strangely, even if I use the same files in process 2 for the t-test vs. difference, I still get different results. So I can do t-test(A vs B), and get an output from that. Then, with the same files in the process 2 tab, I can do the difference (A-B), and then average all participants. So I get average(A-B), which comes out identical to average(A)-average(B).
These are the settings for the t-test that I used:
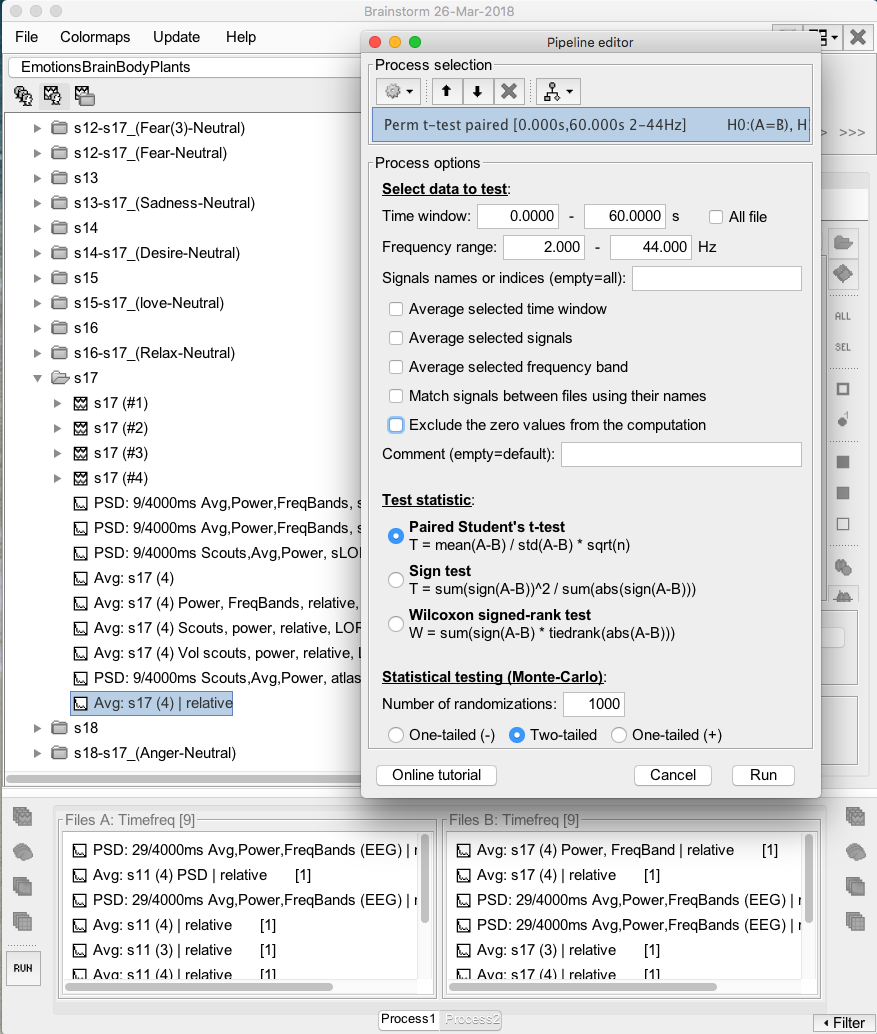
I tried the t-tests with the "exclude the zero values from the computation" checked, with or without the "match signals between files using their names" checked, and I got pretty much the same outcome as the other t-test.
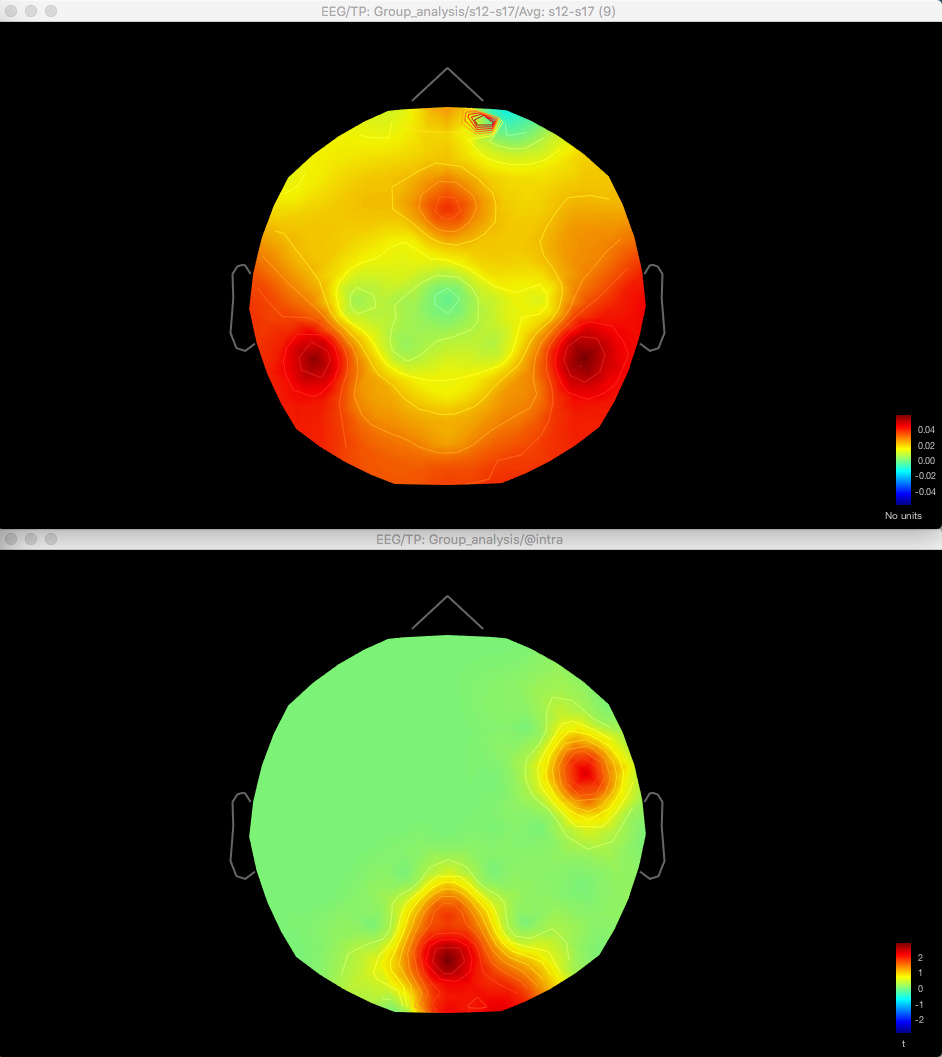
The differences seem more pronounced for higher frequencies i.e beta and gamma. Here's the outputs for beta using the above approach, using the same files in process 2, for the same condition difference as my first post (difference shown above, t-test below):
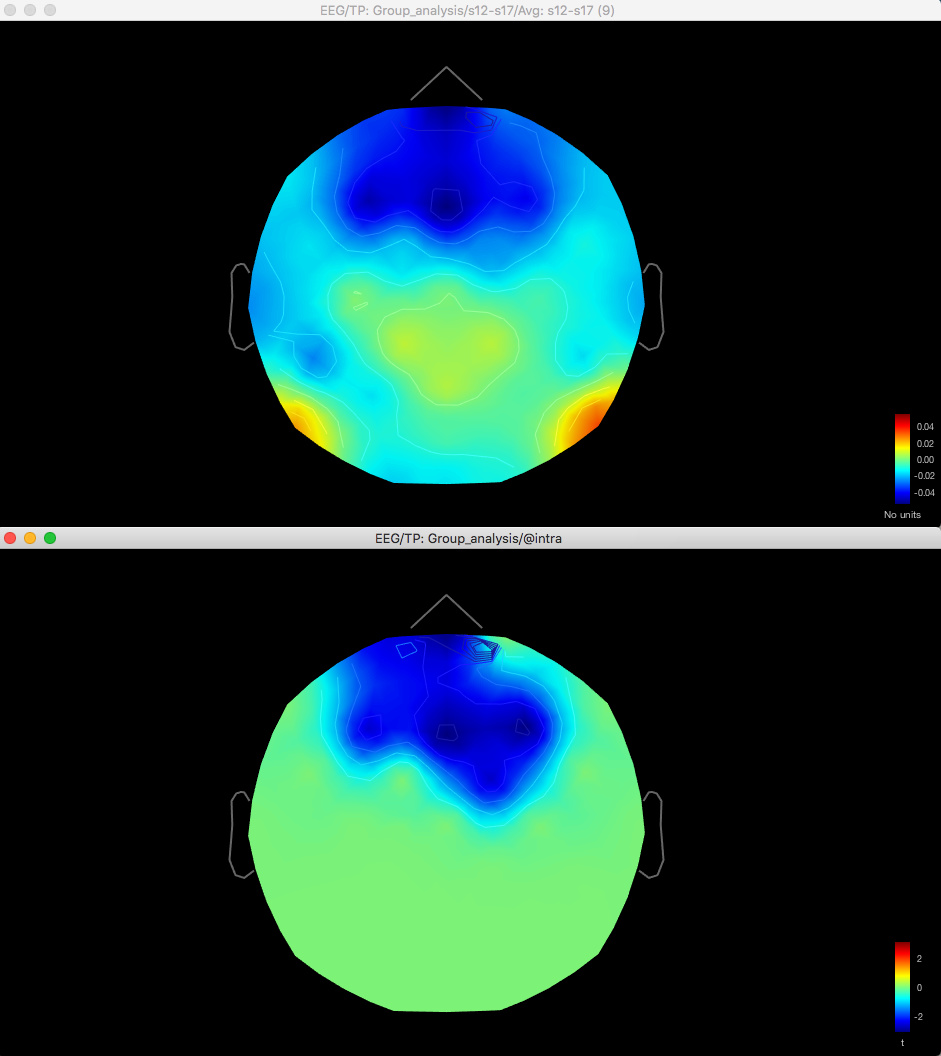
But the differences between theta aren't so great for the same condition difference as above in my first post (difference above, t-test below).
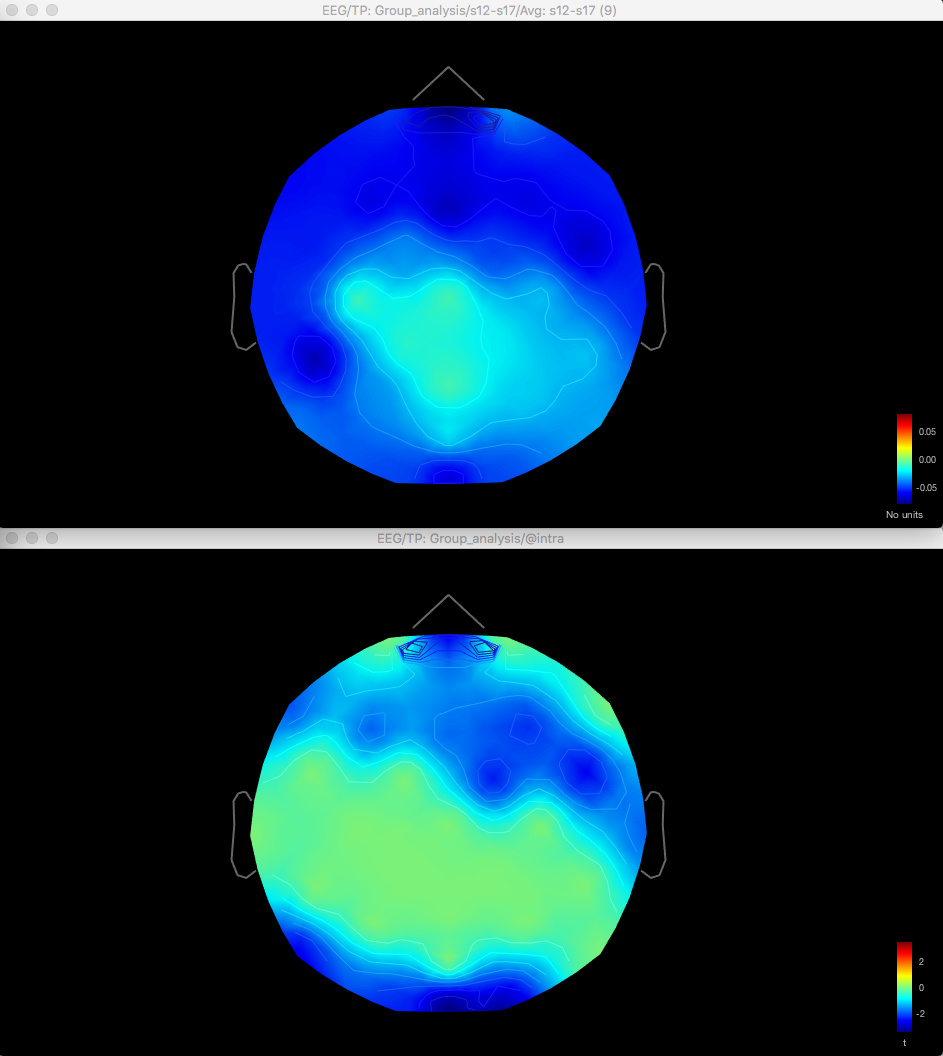
But delta is pretty different:
Thanks again for your time and consideration.
Luli