Hi Francois
I had applied a p threshold of 0.05 in all of the above posts. However when I entered 0.99 as the p threshold, this did resolve most of the differences seen between the t-test results and the difference results, for most of my conditions.
I re-ran the analyses from the start, using a saved pipeline each time, to ensure it wasn't an issue with the processing of the files.
However I still see some differences between the two approaches on a few occasions, in particular at gamma frequencies (and on one occasion, theta). I don't think it can be a bug with the t-test computation, since the other results look the same. And I don't think it can be a problem with my file processing, because the other frequencies within the same condition look the same.
So I think there must be something theoretical going on that I'm not aware of. Could you think of what could cause the gamma frequency results to look different sometimes? The epochs of the trials from which I computed the PSDs were 18 seconds long.
Here's an example of the difference vs. t-test for delta (t-tests on the left, differences on the right):
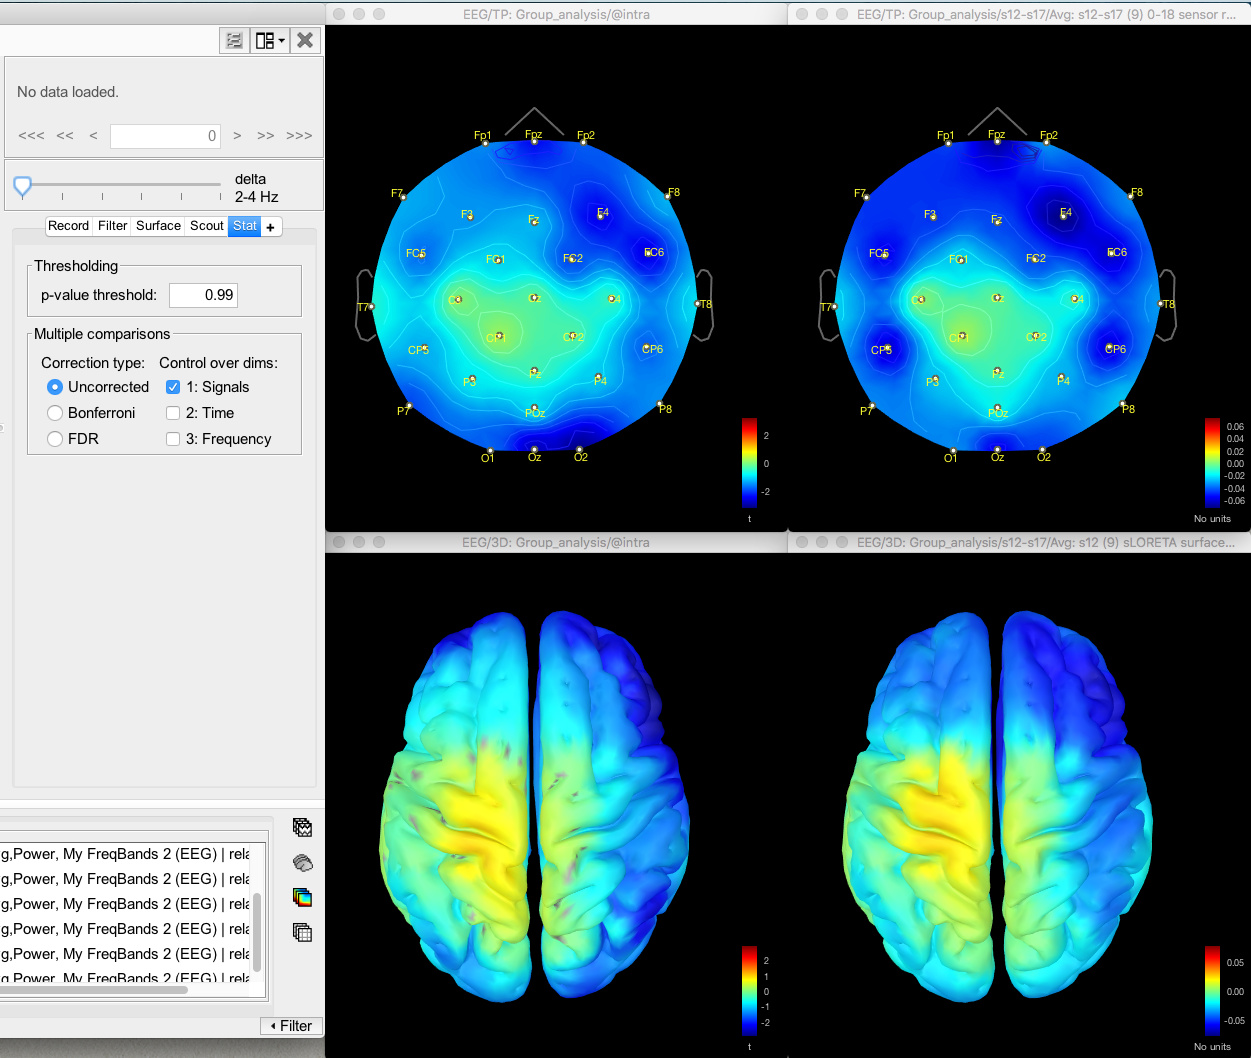
and beta:
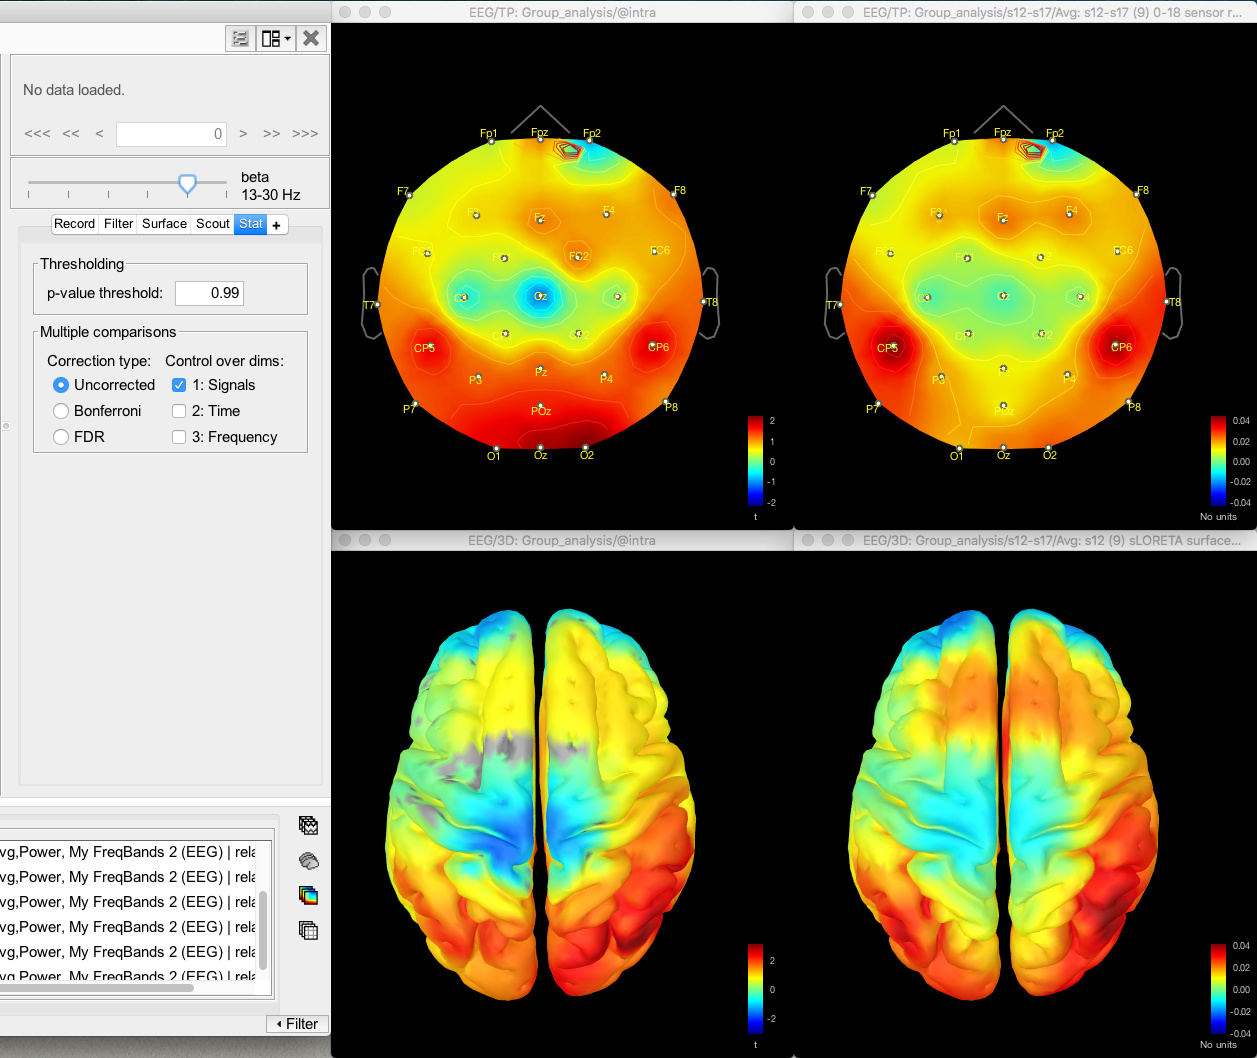
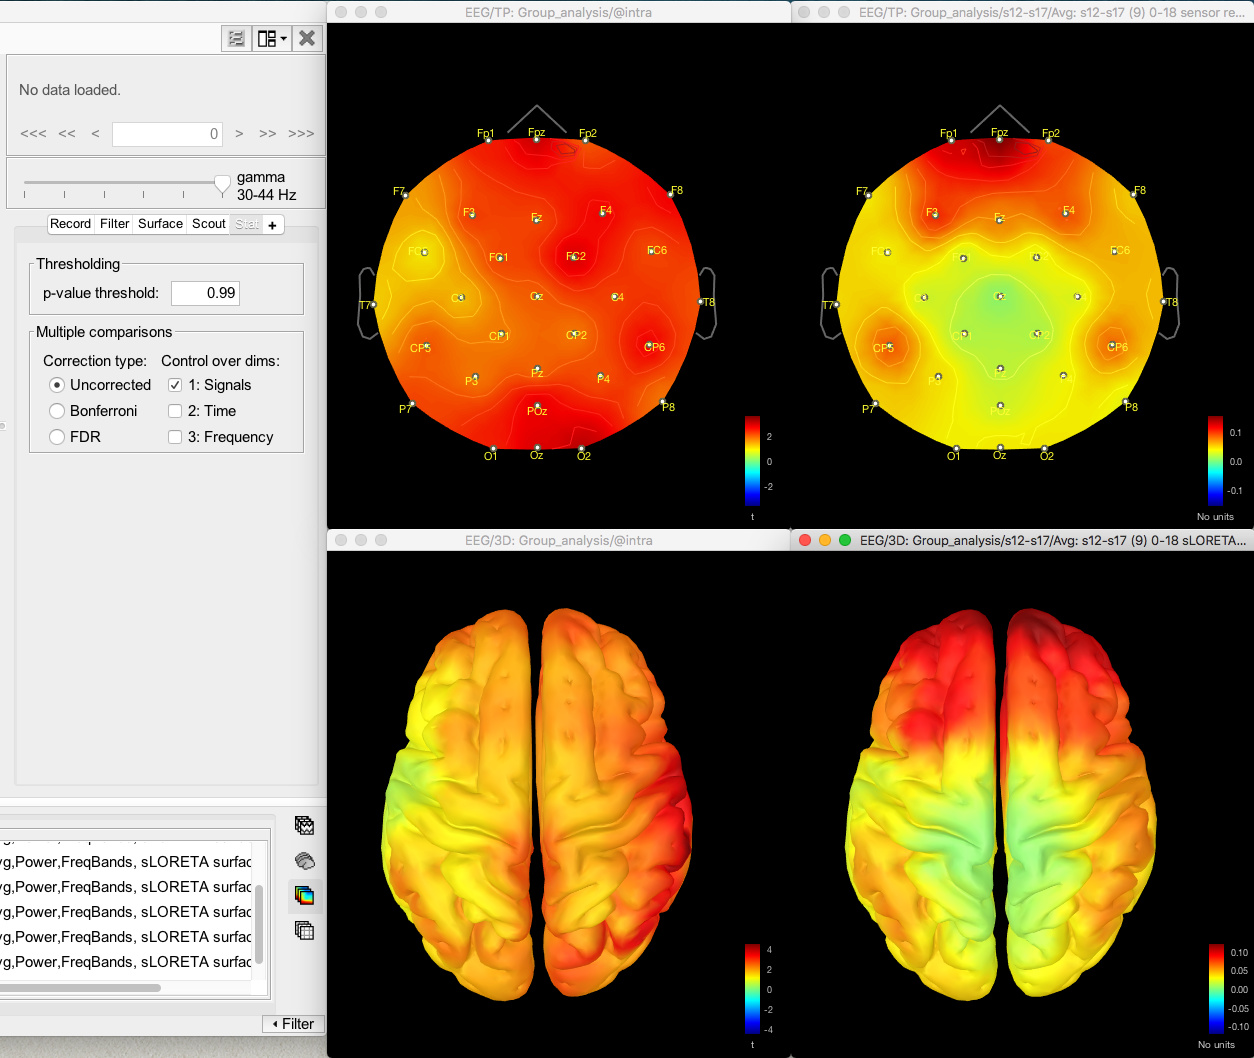
But as you can see, gamma still shows differences, and so I'm not sure which is the most reliable result. I'm leaning towards the difference result, since this doesn't seem to be affected as much by my low n, and because the difference results matched the ANOVA I ran in an external stats program:
Thanks again
Luli