Functional Connectivity

Francois, I have observed something quite curious with the coherence analysis. For some of my signals (10-sec epochs), the resulting coherence is 0 for every frequency. Any idea on why that would be happening? I tried to run mscohere in MATLAB with these signals and I get a 4097 x 1 vector with non-zero values. Note, my data is HPF at 2 Hz so I’m defining my freq resolution as 2 Hz and my max freq as 100 Hz.

Any feedback would be great. Thanks!
YP

Hi Yagna,
This is difficult to tell without having the data in hand.
You can either debug the function bst_cohn.m by yourself, or send me your data (right-click on your subject > File > Duplicate subject, delete all the unnecessary files for the test, right-click on the duplicated subject > File > Export subject).
Francois

Dear Brainstorm users,

I have analyzed my data for changes in functional connectivity by using the coherence measure. I am at the point where I need to start interpreting my results. I am struggling to understand what exactly changes in high-frequency bands for coherence mean when it comes to neural function. If anyone can help me out or point me to some literature, that would be helpful.

Thanks,
YP

Hi Yagna:

Well, it depends on which regions you are talking about and which frequency bands, under which experimental conditions. However and overall, little is still understood about the respective functional processes and mechanisms mediated by the typical frequency bands of electrophysiology. Results, especially those concerning functional connectivity, are still being reported and discussed empirically, until genuine mechanisms are discovered and tested. An excellent read though is Buzsaki’s Rhythms of the Brain .

Hope it helps,

Hey guys,

I’m now working with some EEG data and I would like to conduct some similar analysis in the source domain as with my previous MEG data. To this effect, I have a few questions.

  1. I have used EEGLAB for all the pre-processing/cleaning of my EEG data. Their recommendation is to use SIFT, which is an EEGLAB plugin for source analysis. I’m not familiar with the algorithms it includes, but I am wondering how it compares to Brainstorm when handling EEG data.

  2. Unlike MEG, EEG signals are obviously smeared, so in terms of source analysis, how deep can we estimate the signal? For ex. would dorsal anterior cingulate be reasonable?

Hi Yagna,

  1. No idea…
  2. EEG recordings are a lot more smeared on the surface than MEG, but it should be capable of “seeing” activity from deeper regions in the brain. However the potentials recorded for deeper activities are so smooth that it might be very difficult to localize them. I don’t know hoe to quantify those effects…

Cheers,
Francois

Hi,
I’m trying to figure out the best way to compute phase-amplitude coupling between two regions, as if it were another metric of functional connectivity. For example PAC between hippocampus (theta band) and prefrontal cortex (in gamma band) or more ideally, to use hippocampal theta as a seed time course, with which to compute PAC with the rest of the brain in gamma band.
Is there a built-in way to do this? Sorry if this has been discussed elsewhere.
thanks very much!
Dani

This is interesting: however the PAC code in BrainStorm does not support such inter-regional measures presently. We have plans in the near future (a year or so) to make it happen but this is not available yet.

Hi all,
I've read this post but I'm a bit confused about selecting procedure.
Actually, I have 80 second EEG recording and I would like to see which regions of the brain are connected during my 80 second EEG.
I know in the first step I should compute source model. the source model which I'm using is sLoreta.
Then I've used desikan-killiany scout that parcellate the brain to several regions.
in the next step I want to do 2 types of connectivity analysis:
1- I would like to see which brain regions are connected to each other based on this parcellation
2- I would like to see my region of interest ( for instance the Yellow region (LT insula)) is connected to which other regions during my 80 second EEG recording.
I did some try based on this post but I'm not sure I did right or not.
Would you please explain how can I do these 2 types of analysis step by step.

Best Regards,
Hamed

First, for studying connectivity, like any other measure of activity in neuroimaging, you need to compute a contrast between two conditions or two groups of subjects.

Second, you need to base your analysis on specific hypothesis, based on a literature review. Something like “I expect the
coherence at 20Hz to be higher in condition A than in condition B”.

Then you select your source files in the Process1 box, compute the connectivity metric of interest ([NxN] for your item #1, [1xN] for your item #2), then you run a non-parametric test across subjects or conditions to test for significance of the difference between the two sample groups.

Hi Francois
In my previous experiment, we computed the connectivity between regions in resting state and during our task using SPM with fMRI. Now we are trying to do with EEG.
for a test, we used one subject and recorded EEG during rest state and during doing a task.
I've computed source and used a parcellation that I mentioned in my previous post.
But when I want to compute connectivity for all brain regions (NxN) I get the memory error, this error is expected for large computation, but with SPM we did this analyzing and it took sometimes about 1 day or more.
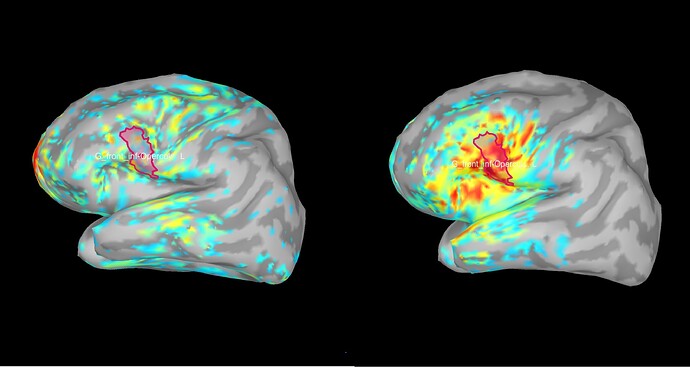
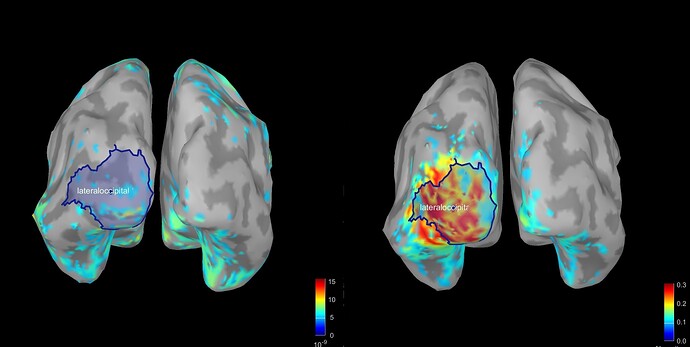
about second part (1xN) when I use 1xN for finding which brain regions are connected to my ROI during the task ( It took about (1hour and half), I've got these results: ( following figures).
How can I interpret this 3D figure?
Can I say these red regions are connected to each other during my 80 seconds recorded EEG or not?
Can I trust to this result because I've tried 3 times with 3 different ROI but in all of them the connected area was just near the ROIs, no other areas of the brain.


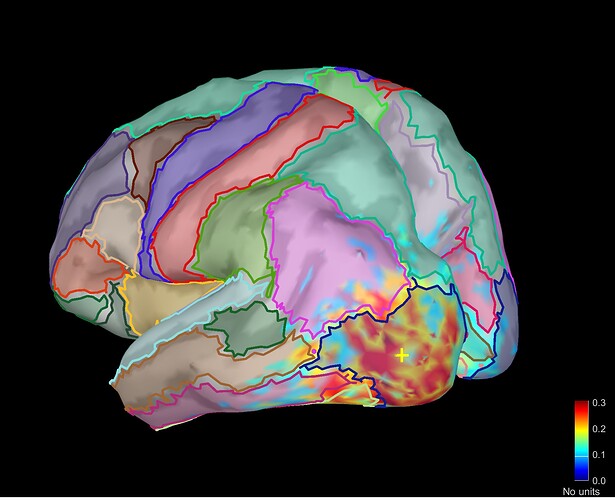
Another issue is after finding connectivity I would like to use parcellation again to see the connected regions name. Is there any possibility to reduce the color of the regions for better representation. For instance a scroll bar like Transp or Smooth for increasing or fading the color. In the fade mode, it will be so nice if we see just borders between regions without regions color.

Cheers,
Hamed

But when I want to compute connectivity for all brain regions (NxN) I get the memory error

Select the option "Use scouts" and "Apply scout function: before".
http://neuroimage.usc.edu/brainstorm/Tutorials/TimeFrequency#Scouts

this error is expected for large computation, but with SPM we did this analyzing and it took sometimes about 1 day or more.

Processing fMRI and EEG are two very different things. Expect much higher memory requirements with EEG.

How can I interpret this 3D figure?

What is your hypothesis?

Can I say these red regions are connected to each other during my 80 seconds recorded EEG or not?
Can I trust to this result because I've tried 3 times with 3 different ROI but in all of them the connected area was just near the ROIs, no other areas of the brain.

You can't expect the spatial precision of fMRI. Source maps estimated from EEG are very smooth, and you cannot expect spatial resolutions any better than 1-2cm. This means that the signals are always very similar in a neighborhood of a few centimeters around each source. You will not be able to separate what is similar because it's connected from what is similar just because it's nearby.
You should start probably with some background reading in EEG source modeling.

What you can do is to compare a condition with a baseline and see if there is a significant increase somewhere.

Actually, I'm looking for some regions connectivity to my ROIs during my task.
For instance, I know during my task lateral occipital region activated. So I want to know which another regions of the brain have connectivity to my ROI during my 80 seconds EEG (for example lateral occipital to frontal or .....)
My analysis is not even related analysis, I want to analyze brain connectivity during entire of EEG.

Hi Francois,
Here I'd like to outline what did I do step by step for connectivity analysis.
1- preprocessing ( 1- 2 bad channels removing 2- Band pass filtering (0.5-40) 3- blink and eye movement artifact elimination using ICA)
2- Import Row data in database
3- Computing head model+ Noise Cov + data Cov
4- Compute sources(2016) (minimum nor imaging ===>> dSPM)
I did these 4 steps for my one subject EEG, in the rest state (eyes closed) and task-state.
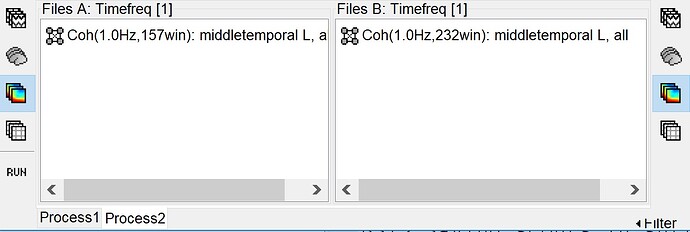
Then For my rest state source, I've put it in Process2 (FileA = Rest state, File B= rest state)

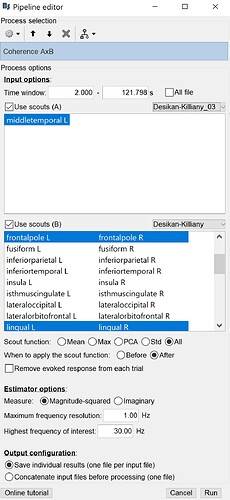
after that connectivity ==> Coherence AxB ( in the top window I've selected my first region and in the bottom window I've selected the scouts that I want to see the connectivity between them to my first scout)
After running a Coh file generated. (please click on the following image to see it completely)

I did this steps for my task state EEG too.
Now I have two Coh files and I have some problems, please help me:
1-Are my processing steps right?
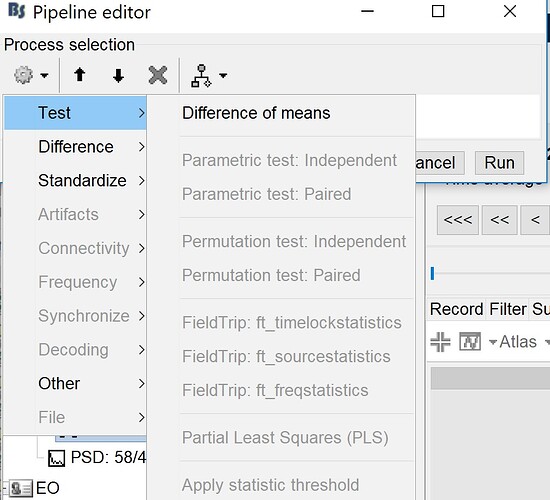
2- when I want to do T.Test between this two Coh for analyzing the connectivity between my regions during rest state and task state I can see just Difference of means. What' is the problem?
How can I use T.Test for these 2 Coh files?

3- I can't display Coh as a graph because of an error that I think should reshape by code as I saw in this topic.
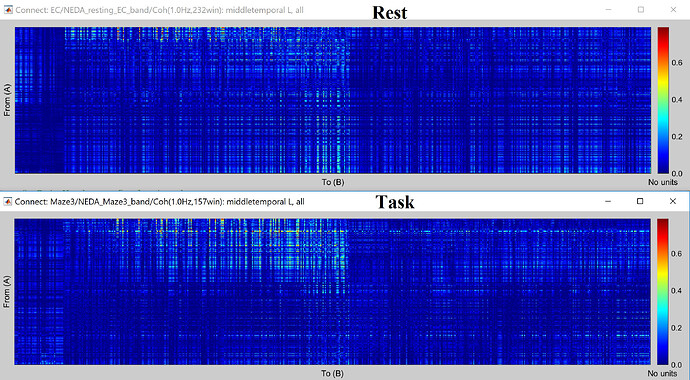
4- when I display Coh as an image I have this following figure. How can I interpret this figure exactly?

5- How can I use these two Coh matrices and how can I say which rest or task state has more connectivity between my ROIs.

Best Regards,
Hamed

after that connectivity ==> Coherence AxB

If you select the option "Scout function: All", it will keep the values for all the possible pairs of sources within all the selected regions. This is probably not what you are trying to do if you want to consider these as "regions of interest".

when I want to do T.Test between this two Coh for analyzing the connectivity between my regions during rest state and task state I can see just Difference of means. What' is the problem?

A t-test is comparison of two groups of samples. Here you have only one sample for each measure and each condition (one experimental session, one subject). The only thing you can do is to compute a different of your two samples, you will not be able to get any significance measure associated with the result of this difference.

Before trying to do this on your own data, please read the corresponding tutorials:
http://neuroimage.usc.edu/brainstorm/Tutorials/Difference
http://neuroimage.usc.edu/brainstorm/Tutorials/Statistics

I can't display Coh as a graph because of an error

Probably because of the option "Scout function: All" you selected. This is not supported by most of the display functions. Note that this graph will not help you understanding anything if your connectivity matrix is not thresholded by some form of statistical testing. For your raw connectivity matrices, I recommend you keep on looking only at the full matrices, it will prevent you from false interpretations of the graphs.

when I display Coh as an image I have this following figure. How can I interpret this figure exactly?

This is the connectivity measure you selected (magnitude-squared coherence) between all the pairs of sources within the scouts you selected, for the frequency that is currently selected in the Brainstorm window (frequency slider).

How can I use these two Coh matrices and how can I say which rest or task state has more connectivity between my ROIs.

Compute a difference between the two.
To know which of the values in this difference are significant, you need many subjects (or many repetitions of the same experiment on the same subject).

Dear Brainstorm Community,

I have a connectivity home project. I suppose to compare PLV and wPLI methods on datasets were created by wMNE and sLORETA in open and close eyes conditions. I’d liket to ask us my pipeline was correct?
1., I did the preprocessing(filtering, artifact rejecting, create epochs by 2s) in eeglab.
2., Calculate sLoreta ImagingKernel from Brodman_Thresh
3., Calculate PLV for every subjects
4., Avg PLV
5., I calculate wMNE ImagingKernel from this PLV and avg it.
6., Calculate wPLI (fieldtrip toolbox) with wMNE and sLORETA imagkernels which I did earlier
I would like to make the differences between the 2 conditions, with connectivity metrics.
Thank you for your answers!

Hello,

I’m not sure I understand what you did here. Source estimation should be done from recordings, not from PLV results.
What part of your processing pipeline are you asking questions about? And what question precisely?

If your goal is simply to test the different methods, and you have them both in FieldTrip, why don’t you run all your processing in FieldTrip?

Francois

Sorry I was wrong. I am bit confused about what is the proper way to get the metrics.
I was wrong in point 5 I wanted to write that I calculated the PLV values and averaged it from wMNE imaging Kernel.
My question is did I chose a proper pipeline if I want to compare the open and close eye resting state connectivity metrics PLV and wPLI?

It could be OK, but there are too many options for each of this steps to say whether you did it correctly or not.
If you want an advice on your work, please provide more details on your pipeline and maybe some screen captures to illustrate the various steps (the process options, the database structure, the display of the result, etc).
Maybe I would be able to spot some obvious mistakes.