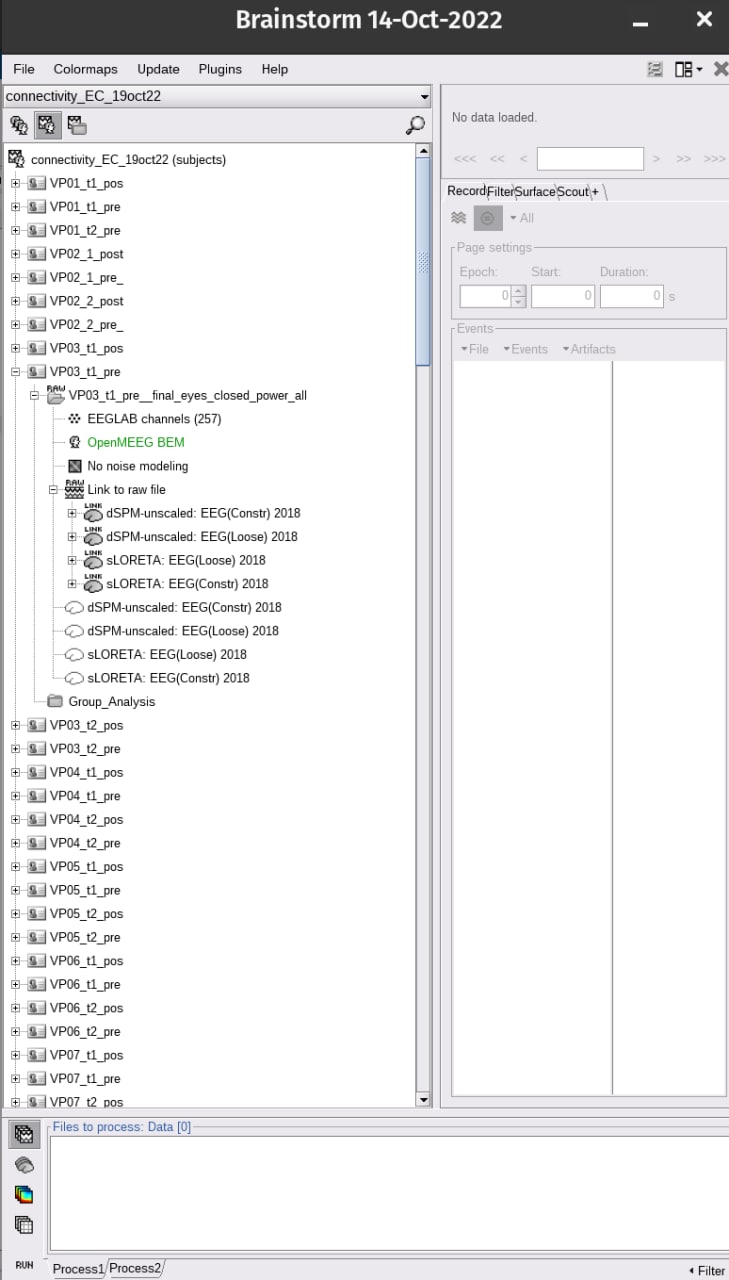
I have EEG data of 41 subjects. Their resting-state EEG was measured before and after an intervention that was once active and once sham. Per subject this gives me a total of 4 datasets.
I have calculated per dataset the source data and then, in the source space, I have calculated imaginary coherence between different scouts as defined by an atlas.
What I would like to do is calculating the average imaginary coherence across specific datasets and plot them. This would be a possibility of visualizing the difference in coherence between the two conditions.
Furthermore, I would like to calculate the average source activity across specific datasets and plot them to visualize the difference in source activity between the conditions (e.g. Time contact sheet figure).
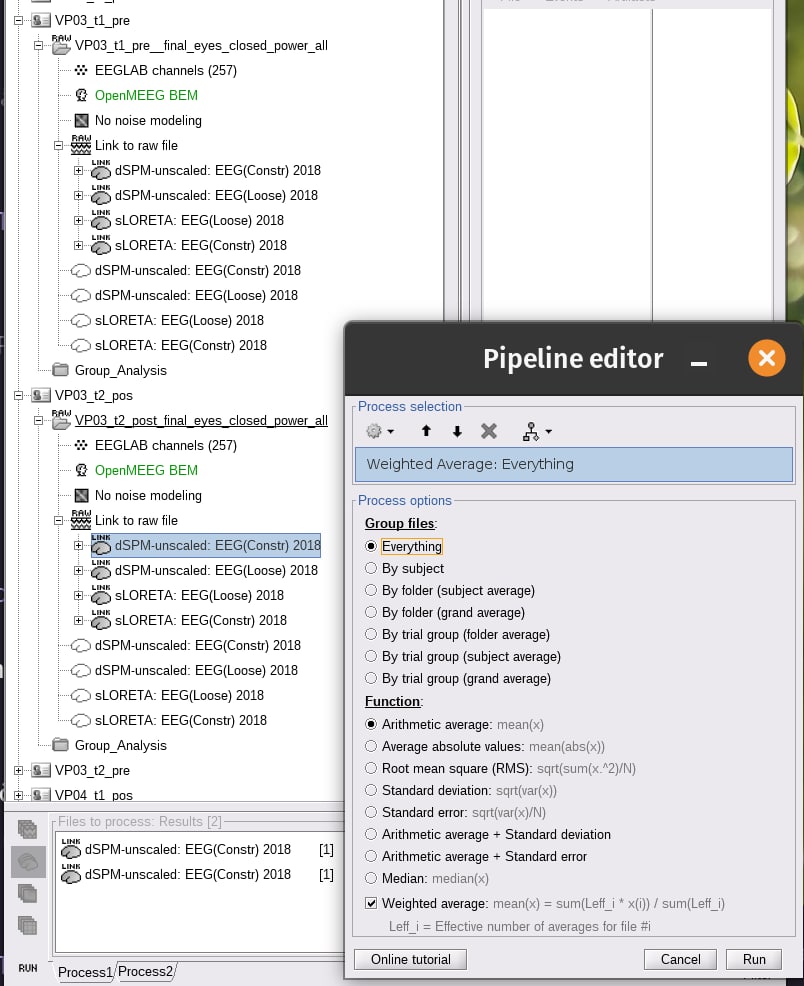
However, when I select e.g. two source-datasets and want to calculate the average between them, MATLAB crashes.
Does it mean that the source-datasets are too heavy?
How can I get an Time contact sheet figure of averaged source activity?
As I do not have individual MRI data, all sources are calculated on the default anatomy anyways and I can skip the step of projecting on default anatomy, I guess?
To get a connectivity graph I could, if necessary, also use MATLAB to extract specific coherence matrices as calculated by Brainstorm, stack them into a 3-dimensional array of coherence matrices per subject and then average them across subjects... but would it be possible to re-integrate this average coherence matrix into Brainstorm to get the connectivity graph of it?
What I would like to do is calculating the average imaginary coherence across specific datasets and plot them. This would be a possibility of visualizing the difference in coherence between the two conditions.
I would like to calculate the average source activity across specific datasets and plot them to visualize the difference in source activity between the conditions (e.g. Time contact sheet figure).
Averaging time series of resting-state data is not expected to produce any interesting result. In the absence of time-locked features (as in an ERP study), there is no hope to increase the SNR of any signal feature by averaging. Resting-state data should be processed in frequency space or using other summary statistics (such as connectivity measures). https://neuroimage.usc.edu/brainstorm/Tutorials/RestingOmega
Does it mean that the source-datasets are too heavy?
Yes. The source files you seen in the database for each dataset are saved in an optimized way, EEG + imaging kernel, which are multiplied on the fly when needed. This multiplication to obtained full source maps is possible only for a limited number of time samples, as it generates gigantic matrices (15000 * samples * 8 bytes). If run a process that is not optimized to handle this type of data, the full source matrix is computed and this may crash Matlab. https://neuroimage.usc.edu/brainstorm/Tutorials/SourceEstimation#Output_mode
As I do not have individual MRI data, all sources are calculated on the default anatomy anyways and I can skip the step of projecting on default anatomy, I guess?