I want to correlate alpha ERD results with behavioral data, but I do not know how to quantify the ERD results. I got a three-dimensional matrix for each subject, e.g., in the source level, voxels * timefrequencies (150022028*6). I want to see M1 regions, alpha ERD, in a specific time window (1s-2s). Could you please tell me how to reduce the three-dimensional matrix to one value for correlation analysis?
I will define a scout, and an expert said that he could give me an atlas (fMRI) which already defined the related ROI. Could you please tell me whether there was any requirement about the alas and how to apply the ROI in the atlas in my EEG data? Thanks!
Could you please tell me whether there was any requirement about the alas
If has to be a surface atlas if you're using a surface source model (a texture of the exact same cortex surface as the one you use for estimating the sources), and a volume atlas if you are using a volume source model.
Thanks, Francois!
I used OpenMEEG BEM to compute forward head model in cortex surface, and sLORETA for inverse head model. Does this mean I am using a surface source model? Thank you!
Thanks a lot, Francois!
I wonder if I computed ERD in the source level from the whole brain (rather than define ROIs), is it possible to select the M1 regions for average from the 3D matrix (15002timefrequency)? If possible, how to slect? I am sorry that I do not know which part of the 15002 is related to M1 region.
I'm sorry, I didn't follow what you were trying to do.
Can you please post a few screen captures to illustrate your question? what kind of file do you already have, and what kind of results of display do you want to obtain?
Apologies for not making it clear.
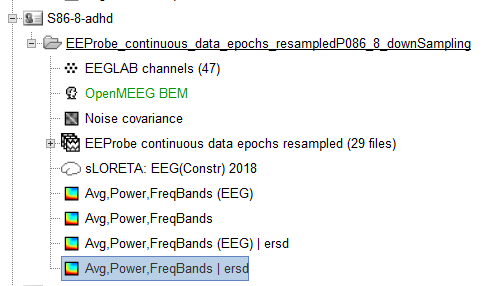
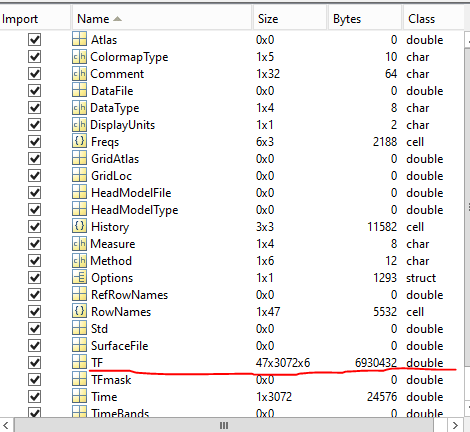
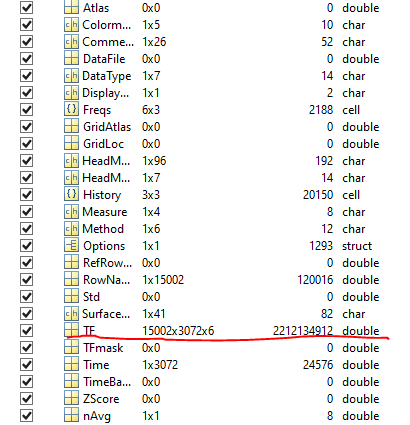
I want to correlate the ERD result with clinical tests, so a value need to be extracted from each participant. I have already performed sensor-level ERD and source-level ERD in each participant (Figure 1). I have also had ERD data in source level and sensor level (Figure 2, Figure 3). In sensor-level ERD, the TF data was 47x3072x6 (channel x time x frequency), and 15002x3072x6 in the source level.
I want to obtain a value concerning M1 region to do correlation. For example, in the sensor ERD data, I may average data by selecting three electrodes related to M1 region and 1s-2s time as well as alpha. In other words, obtained a averaged value from the 47x3072x6 matrix. Now I want to obtain a similar value in the source level. In the 15002x3072x6, 1s-2s time and alpha will be extracted for average, but I do not know how to extract data related to M1 region from the 15002 vertices. Could you please tell me how to extract the data? Thank you very much!
You should be able to extract the values associated to a scout with the process "Extract > Scouts time series", even from your normalized time-frequency maps. This would save one scout signal for each frequency band.
If you want to extract first the alpha band, so that you obtain only the scout value for one frequency band, run first the process "Extract > Extract values" and select the frequency band 8-12Hz.
Note that a lighter option would have been to compute the time-frequency decomposition only for the scouts of interest, instead of computing the full source maps and then extracting the scout. This would have avoided creating these huge files (15002x3072x6 => 2Gb).