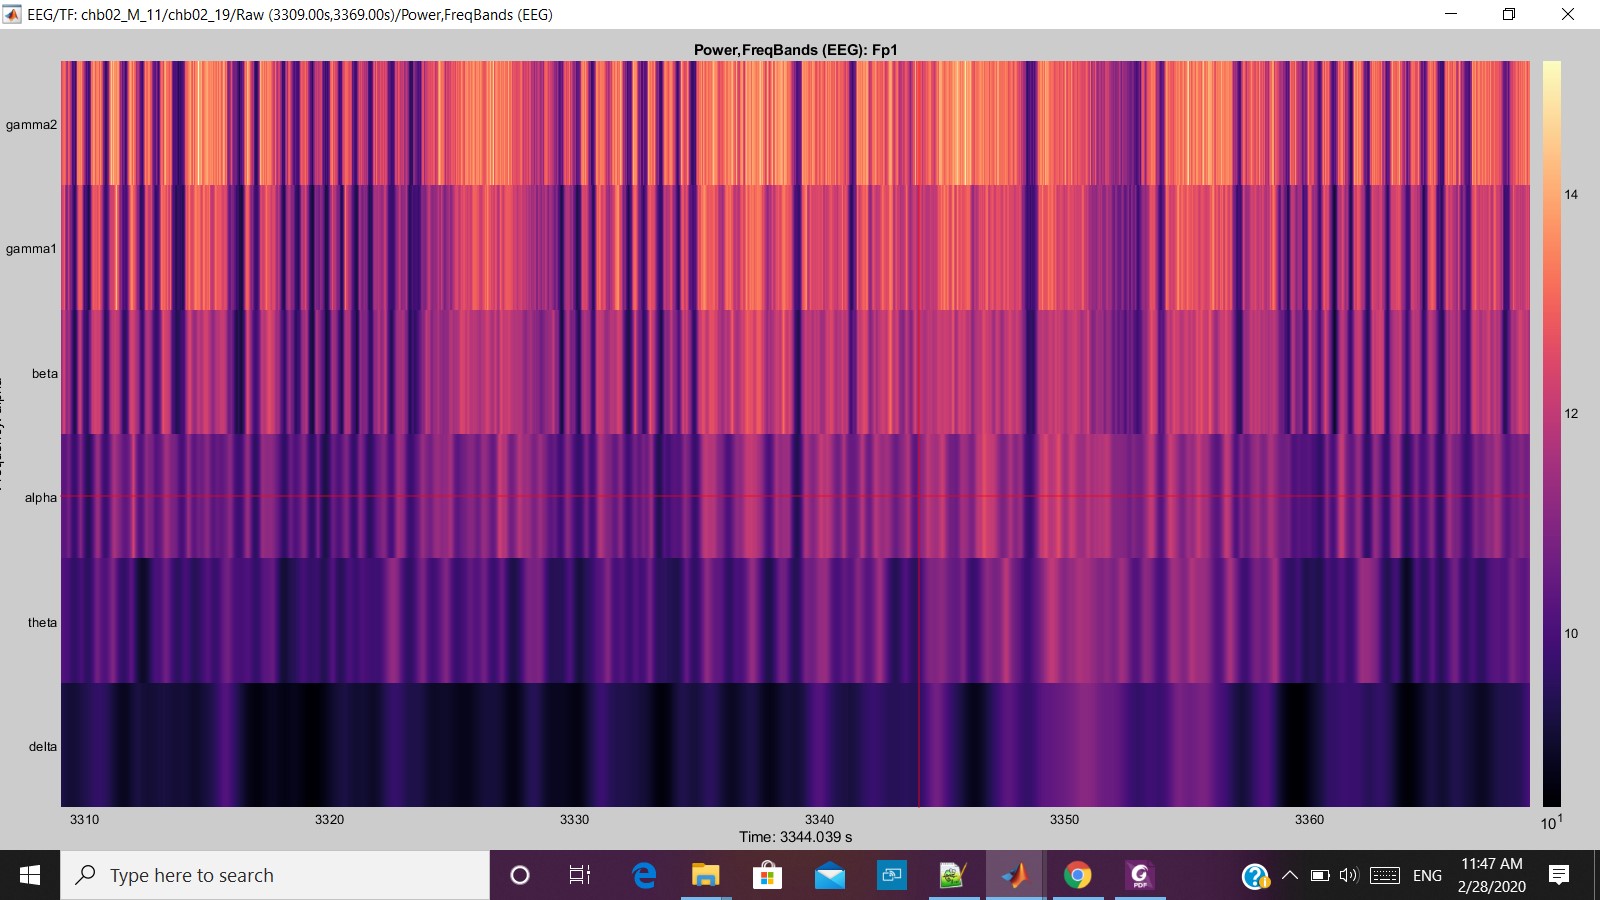
I am working in the Brainstorm Software for EEG signal processing and try to extract the Time-frequency. That was extracted through the pipeline editor.
The problem is that how can I directly get the Time-Frequency in image form the brainstorm to Matlab or Can be saved in the .jpg/.png format in local derive.
Can It be done through programmatically? So, that I can save lot of time by doing that manually?
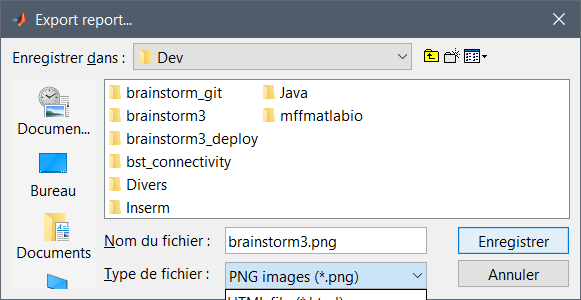
You can open the file with view_timefreq, then configure it with functions in panel_display.m or figure_timefreq.m. Set it to the appropriate size (change the "Position" property of the Matlab figure handle).
Then take a screen capture with one the following functions:
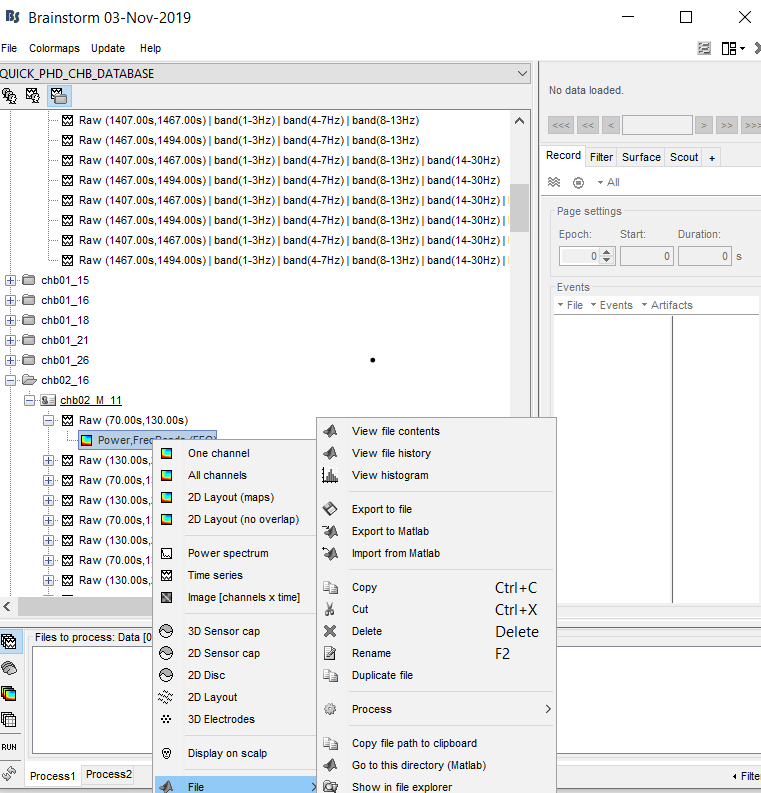
I don't know about how to view the TF in " open the file with view_timefreq".
I have attached the screenshot too.
Help me, Francois thanks for a quick reply.