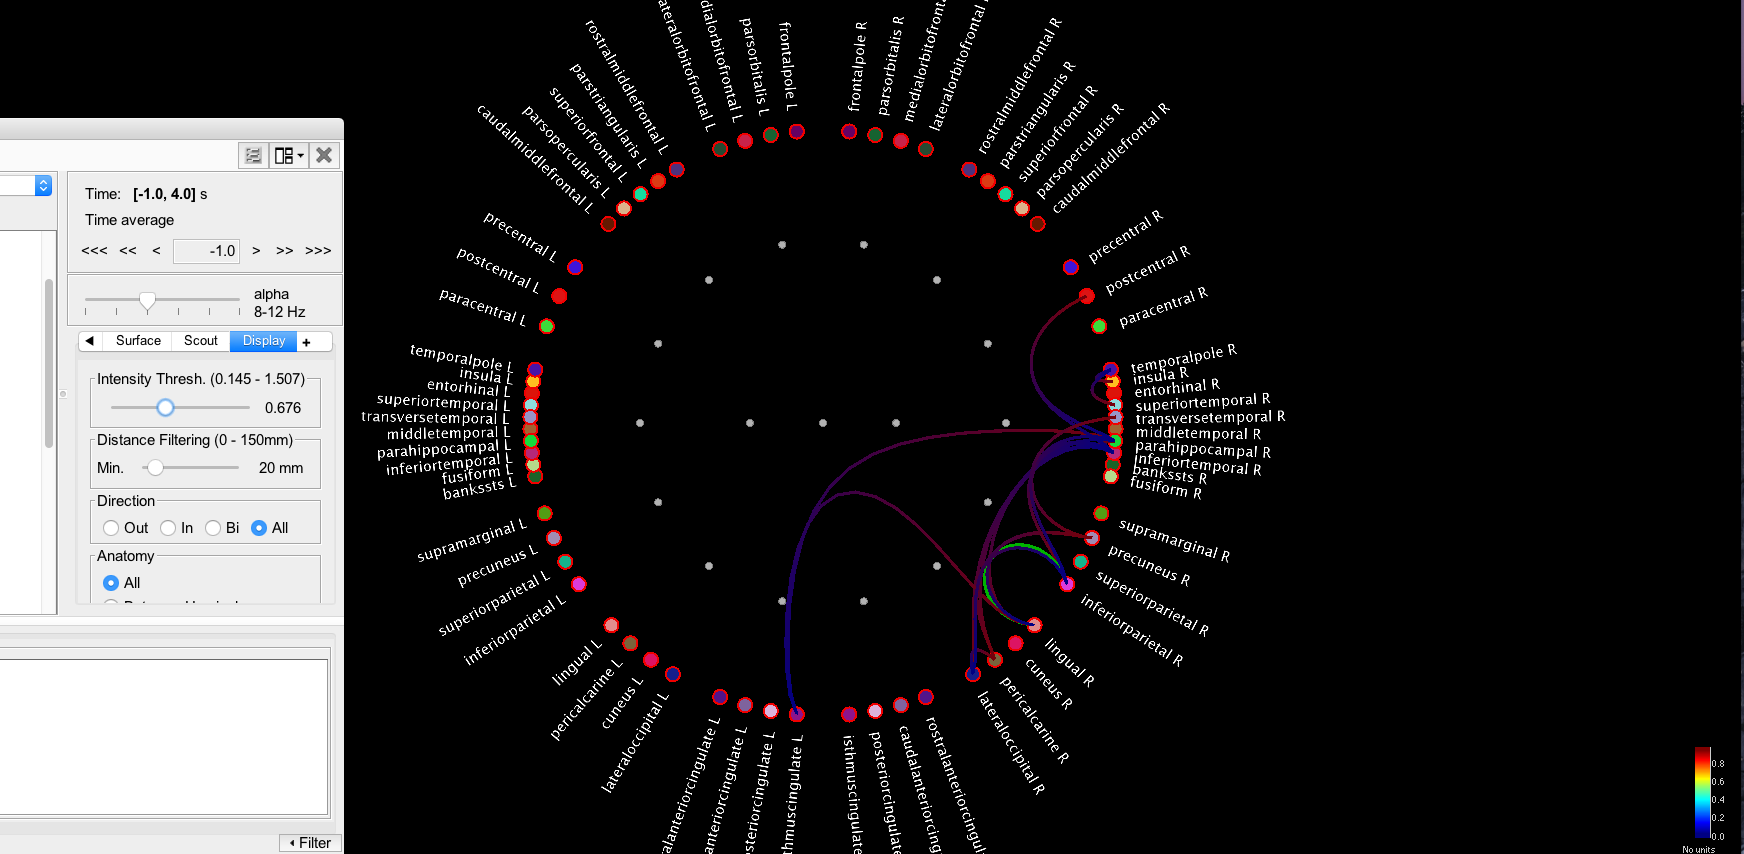
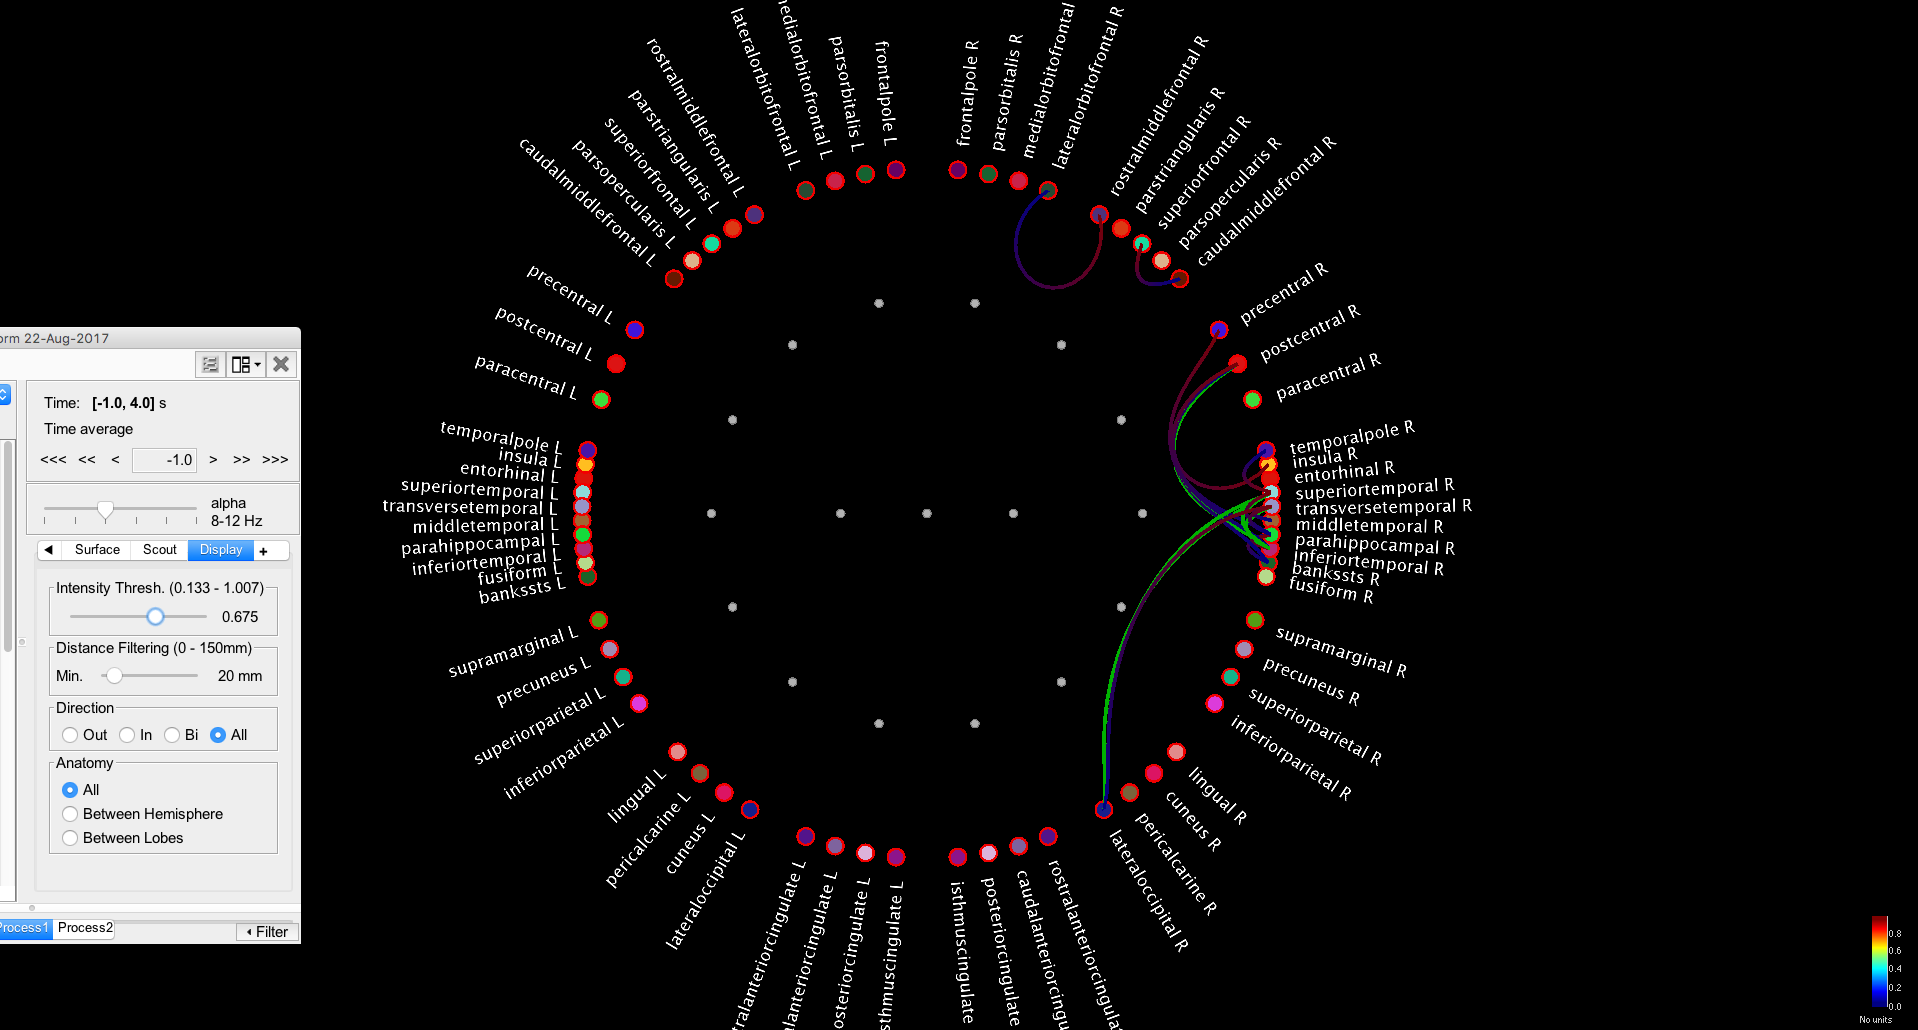
I am calculating Bivariate Granger Causality (spectral) for scout time series. I am particularly interested at right temporal region and the connectivity difference in this region in two different sessions. Looking at a single subject at alpha frequency I can see some differences in session 1 vs session 2 at right temporal region. However, I am wondering about the intensity threshold cause it is different for each graph. How one would constrain the intensity threshold to certian limit so the results are comparable between sessions?
Is this intensity threshold corresponds to the strength of connections between regions or represents something else in the context of Granger causality? Any suggestions about: If I would like to run a statistical analysis (across subjects) for showing alterations in connectivity (because of training) in right temporal region in session1 comparing to session2, is there any option avaiable in Brianstorm to run such analysis.
Attaching the figures of session 1 and session 2 comaprisions. (Above --> session2 Below---> session1)
How one would constrain the intensity threshold to certian limit so the results are comparable between sessions?
The intensity threshold slider is set based on the maximum value for each file. If the maxima are different, the threshold slider will not behave in the same way. There is no solution for making the display homogeneous across files. This issue has already been identified. A complete re-coding of the connectivity graphs is needed, but we lack of resources for this.
One way of representing the difference between the two conditions is simply to compute the difference with the Process2 tab, and to display it.
Note that this "intensity threshold" slider should not be used as a proper way of thresholding to the data. It hides everything that is lower than a fraction of the maximum, and its effects on a connectivity graph based on Granger values might not be very meaningful. What you need to do is a proper test across subjects, as you mentioned.
I would like to run a statistical analysis (across subjects) for showing alterations in connectivity (because of training) in right temporal region in session1 comparing to session2, is there any option avaiable in Brianstorm to run such analysis.
Thanks for the reply!
Also wondering that is it possible to visualize the connectivity on the cortex (that is currently on the graph)? Or any other way to do that?
Not with the option you selected.
If you want to display a cortical map: select the process [1xN] instead of [NxN], and select one seed region. You will be able to visualize the connectivity measure between one region and the rest of the brain.
To get the center of mass of a scout, you can do something like this:
iDK = find(strcmpi({sSurface.Atlas.Name}, ‘Desikan-Killiany’));
iVertices = sSurface.Atlas(iDK).Scouts(…).Vertices;
mean(sSurface.Vertices(iVertices,:));
For each new question, please create a new thread. Threads with multiple topics are difficult to search and read through. Thanks