Hi
When I am trying to adjust the scaling in the following plot, it gives an error message:

How to fix it?
Thanks
Hi
When I am trying to adjust the scaling in the following plot, it gives an error message:
How to fix it?
Thanks
I ran some tests but could not reproduce this error.
There is maybe some bug related with a particular case of this file you are trying to display.
Are you getting the same error with all the correlation files you are trying to display?
Could you share an example file, so I could try to debug it on my end? (upload the corresponding .mat file somewhere and post the download here)
Ok thanks, I will put the data.
This is the link for the data, 2 versions of .mat files:
https://drive.google.com/open?id=1ppNSxHe_ygomJYd9uOj6EVipTf61RoyV
I meant: sharing the connectivity files for which you have this error.
Right-click on a file for which you have this problem, right-click > File > Show in file explorer, zip it together with the channel file, share the .zip file.
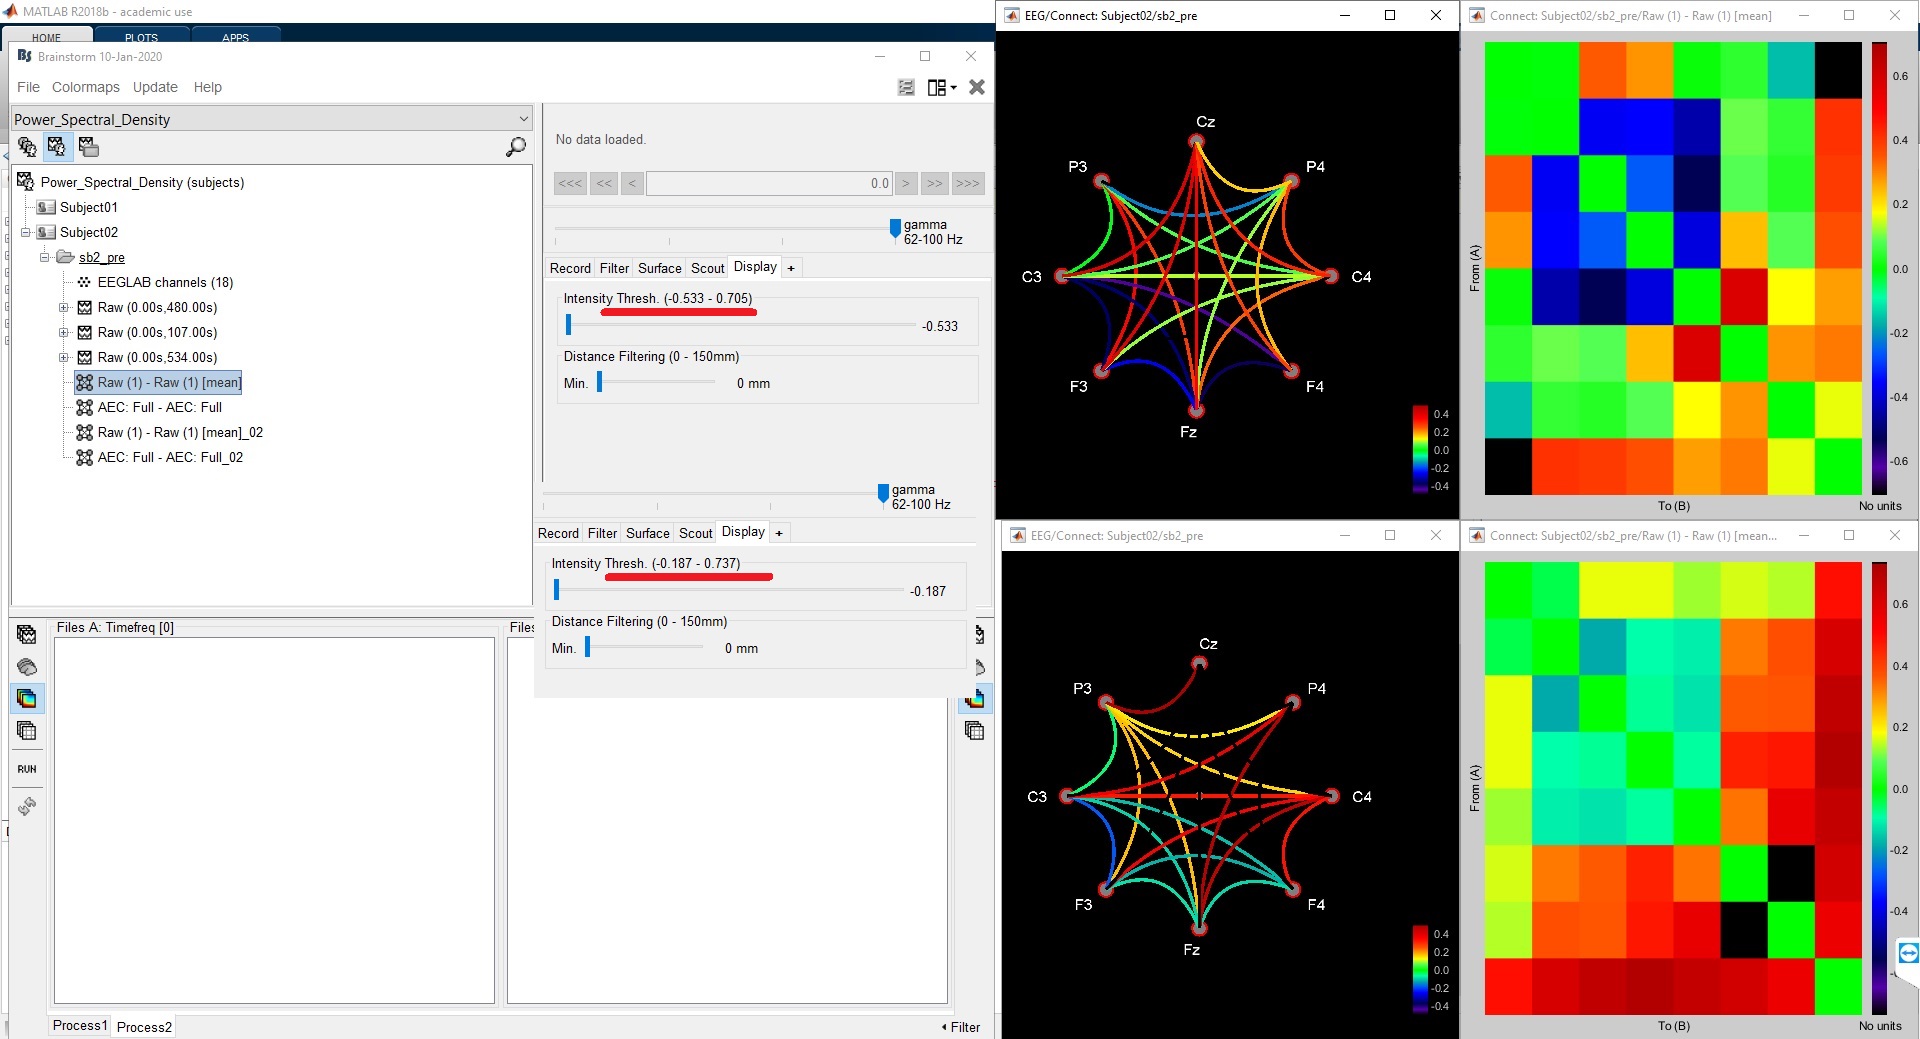
I updated my Brainstorm and now can adjust scaling. However, there is another issue. In the figure bellow, there are 2 comparisons, B-A (top) and C-A (bottom). What is the issue the intensity threshold is different for these 2 comparisons (it is also different for every single condition without any subtraction). Is it possible to make thresholds the same? Thanks
No, unfortunately this is not something you can do easily. This graph display mode has many issues that we will need to fix at some point, but it is not part of our immediate priorities.
If you want to obtain figures that you can compare directly between connectivity files: use the image display (the figures on the right in your screen capture), and set manually the maximum of the colormap.
OK, thanks.
I can actually adjust the scale for the figures on the right half. Also, it seems that there is no threshold for the the figures on the right half. The threshold is it only for the left figures? I I would put the threshold numbers the same manually, should be fine?
No, there is no threshold for the connectivity matrices displayed as images, all the values are displayed.
Ok, thanks.