Hi,
I am a graduate student at Niigata University. We are using Brainstorm for our research. Thank you for your wonderful software. We are always grateful.
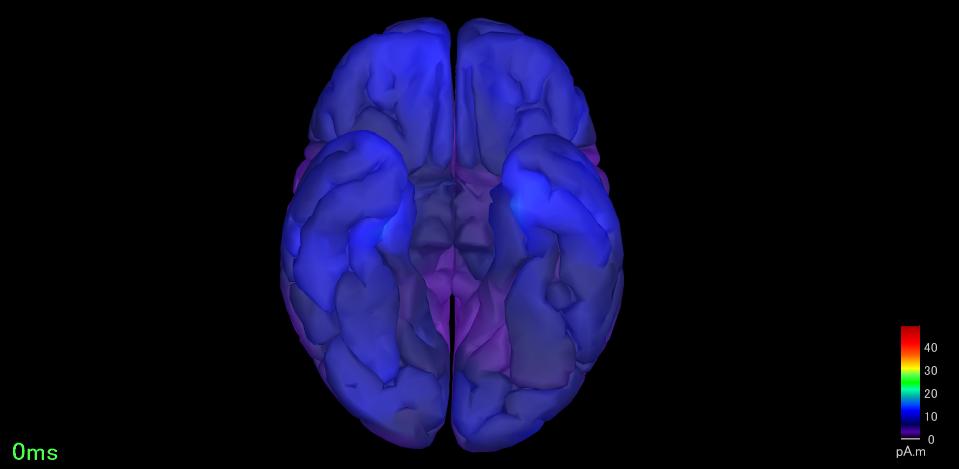
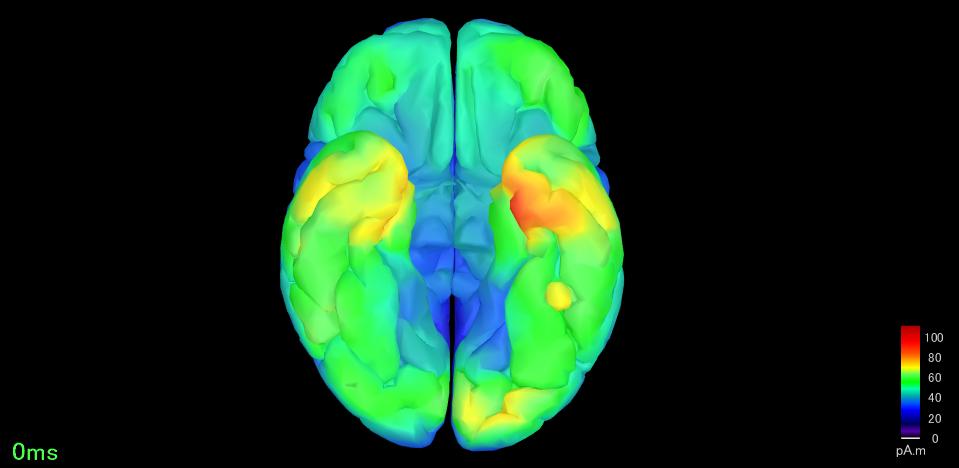
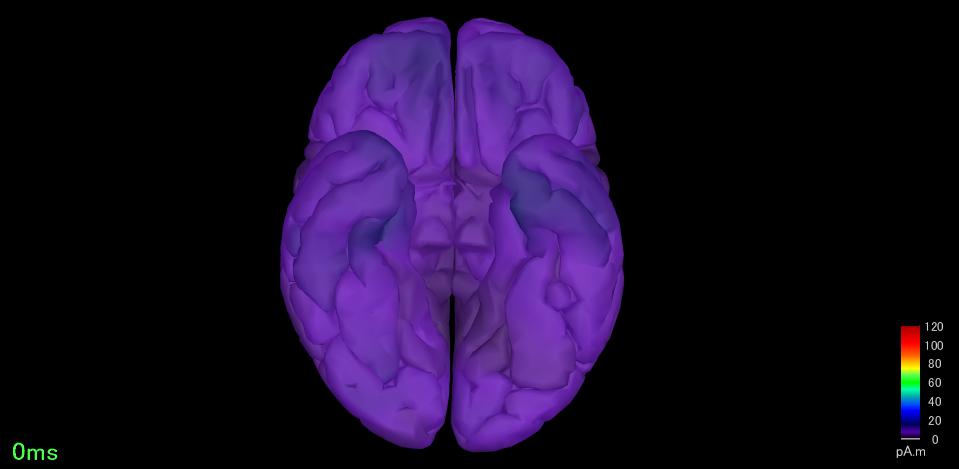
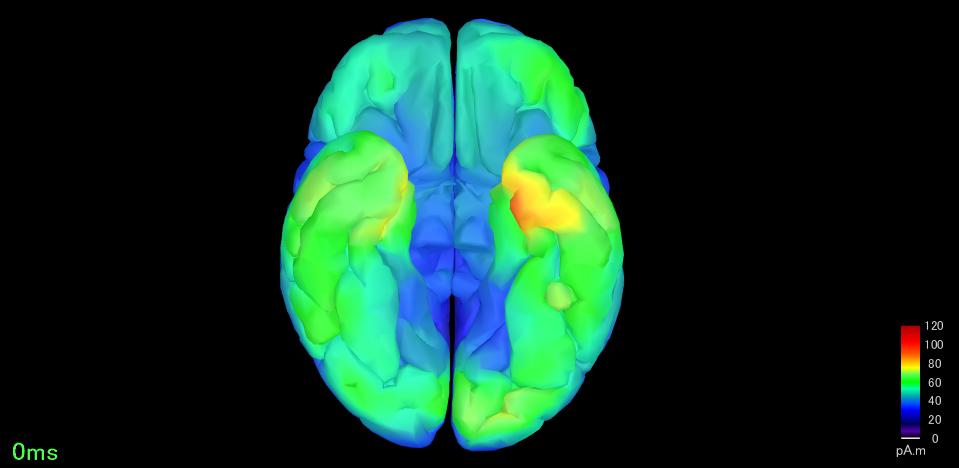
Currently, our research team is trying to estimate current sources from MEG data obtained from 64 trial tasks. The two procedures below yielded different results when averaging 64 trials.
① Average MEG data from 64 trials (from 64 data to 1 data) → Current source estimation from averaged MEG data (1 data) → Interpolate to standard brain (1 data)
② Current source estimation for each of the 64 trials (64 data) → Interpolate all to the standard brain (64 data) → Average the current source estimation results (from 64 data to 1 data)
The minimum norm method was used for current source estimation, and the ICBM 152 Nonlinear Asymmetric template was used for the standard brain.
Why does this phenomenon occur, and which analysis method is correct? Could you please tell me. I kindly thank you.
These two approaches should give to the same results for constrained sources. For Unconstrained sources, they will not be the same as the source maps are flattened before the projection to the template.
Was your analysis done with the minimum norm method and constrained sources?
If so:
Could it be that the differences was in the colorbar scale?
Can you provide some screenshots?
For the case of constrained sources, the first approach is recommended as it creates only one source file (the one projected in the template). While the second approach creates 65 source files (64 for each trial projection to the template and the average of them)
Thank you for your reply.
To make it easier to understand, the analysis steps are illustrated using figures. Please check the PDF.
This analysis was done with the minimum norm method and constrained sources.
I created a PDF file for the two approaches. Please find the attached documents.
In this explanation, I omitted the process of interpolating the default anatomy.
Thank you in advance.
"Justification: Cortical maps have ambiguous signs across subjects: reconstructed sources depend heavily on the orientation of true cortical sources. Given the folding patterns of individual cortical anatomies vary considerably, cortical maps have subject-specific amplitude and sign ambiguities. This is true even if a standard anatomy is used for reconstruction. "
Thank you very much for your kind words. I understand.
I would like to do a group analysis. In this case, I tried the above two analysis methods.
When I performed the statistical analysis of two groups by the method ①, I could not obtain significant results when I performed multiple comparison correction, perhaps because of the small number of samples (10 vs. 11).
Therefore, I attempted to secure the number of samples (640 vs. 704) by using the current source estimation results for each trial in method ②. My guess is that this method will yield significant results after correction. Is this idea correct?
Also, if I use the per-trial current source estimation results, at what stage is it correct to process the computing absolute values?
Under this approach the focus is in the variance across subjects rather than trial-variance within each subject. Thus the group analysis is carried on subject average for each subject in the two groups.
This is not correct. The group-level analysis focuses in the contrast between the two groups, here the subject averages are considered independent observations from the groups; this will not be true for individual trials from the same subject. Although the number of observations (number of subjects) is reduced, subject average across trials has improves SNR.