Hi all,
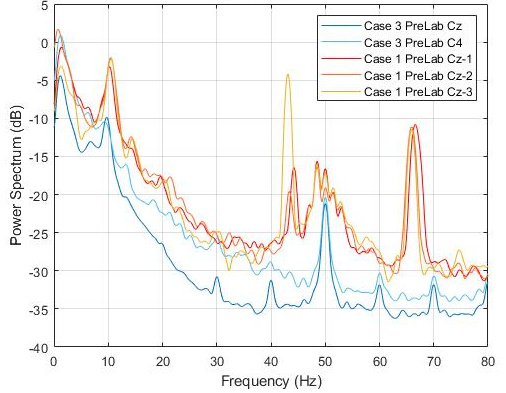
Is it possible to overlay multiple power spectra from different subjects and at different time points into one graph? I am trying to see how the power spectrum from person A differs over time compared to person B over time.
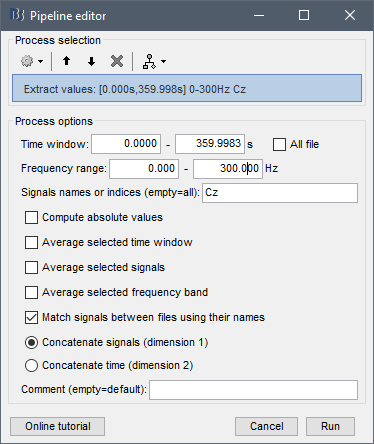
I know this can be done through MATLAB but I would like to do this from Brainstorm as well.
Thanks in advance.