The same units should be displayed at the bottom of the figure when you have a time window selected, and at the top-right corner (column view) or left side (butterfly view) of the figure. If this is not the case, there is something wrong with your data import.
All the values are save international units in the files of the Brainstorm database. For EEG, this means that the values saved in the imported data files should be in the range of 10^-6 (microVolts) to 10^-3 (milliVolt), and displayed as microVolts.
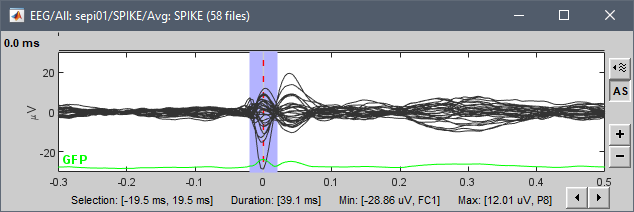
Example of the EEG/Epilepsy tutorial: https://neuroimage.usc.edu/brainstorm/Tutorials/Epilepsy
Right-click > File > Export to Matlab > "DataMat":
Data exported as "DataMat"
>> Fmin = min(DataMat.F(:))
Fmin =
  -2.7289e-04
>> Fmax = max(DataMat.F(:))
Fmax =
   1.0945e-04
If you see "No units" anywhere when displaying EEG data that haven't been normalized, you should fix your import procedures before moving forward, as all the units will be wrong.
to extract>find maximum in time fo a time window around my peak: it is running but then I have a graph with straigh lines but no numerical values..?
These straight lines ARE your maximal values. As you have only one per sensor, these appear as flat.
To do something with these values, you need to process them manually with Matlab.
To get started with Brainstorm scripting, read this tutorial:
https://neuroimage.usc.edu/brainstorm/Tutorials/Scripting