Hello Brainstorm community!
I am trying to estimate the source activity of EEG data for two different experimental conditions and then run some statistical analysis.
Since I am new to Brainstorm and the results I am finding are not so straightforward to be interpreted, I would highly appreciate if anybody could provide me some feedback about the pipeline I have adopted! In the following you can find a schematic overview of the procedure that I have implemented so far:
-
I have preprocessed and epoched EEG data of 25 subjects on EEGLAB. Then I created a new protocol on Brainstorm, selecting "Yes, use protocol's default anatomy" and "Yes, use one channel file per subject" for the default anatomy and channel file, respectively.
-
I have imported the EEG data, separating the trials into two folders according to the experimental condition.
-
EEG channel locations were adjusted by visual inspection from: MRI registration -> Edit..
-
I have computed the head model selecting "Cortex surface" and OpenMEEG BEM as forward modelling method, using then the default options for the OpenMEEG.
-
I averaged trials for each subject among the same experimental conditions.
-
After adding an identity matrix for the noise covariance I computed the sources (creating a shared imaging kernel for each subject): minimum norm imaging as method, current density map as measure and constrained source model. Further, I did not use depth weighting and no covariance regularization.
-
Finally I moved the reconstructed sources of condition A (grand average for each subject) in the left window of process2 and all sources of condition B into the right window. Then I performed both paired parametric tests (FDR corrected) and non-parametric tests using the ft_sourcestatistics option.
Results are similar between the two analyses. The unexpected result is twofold:
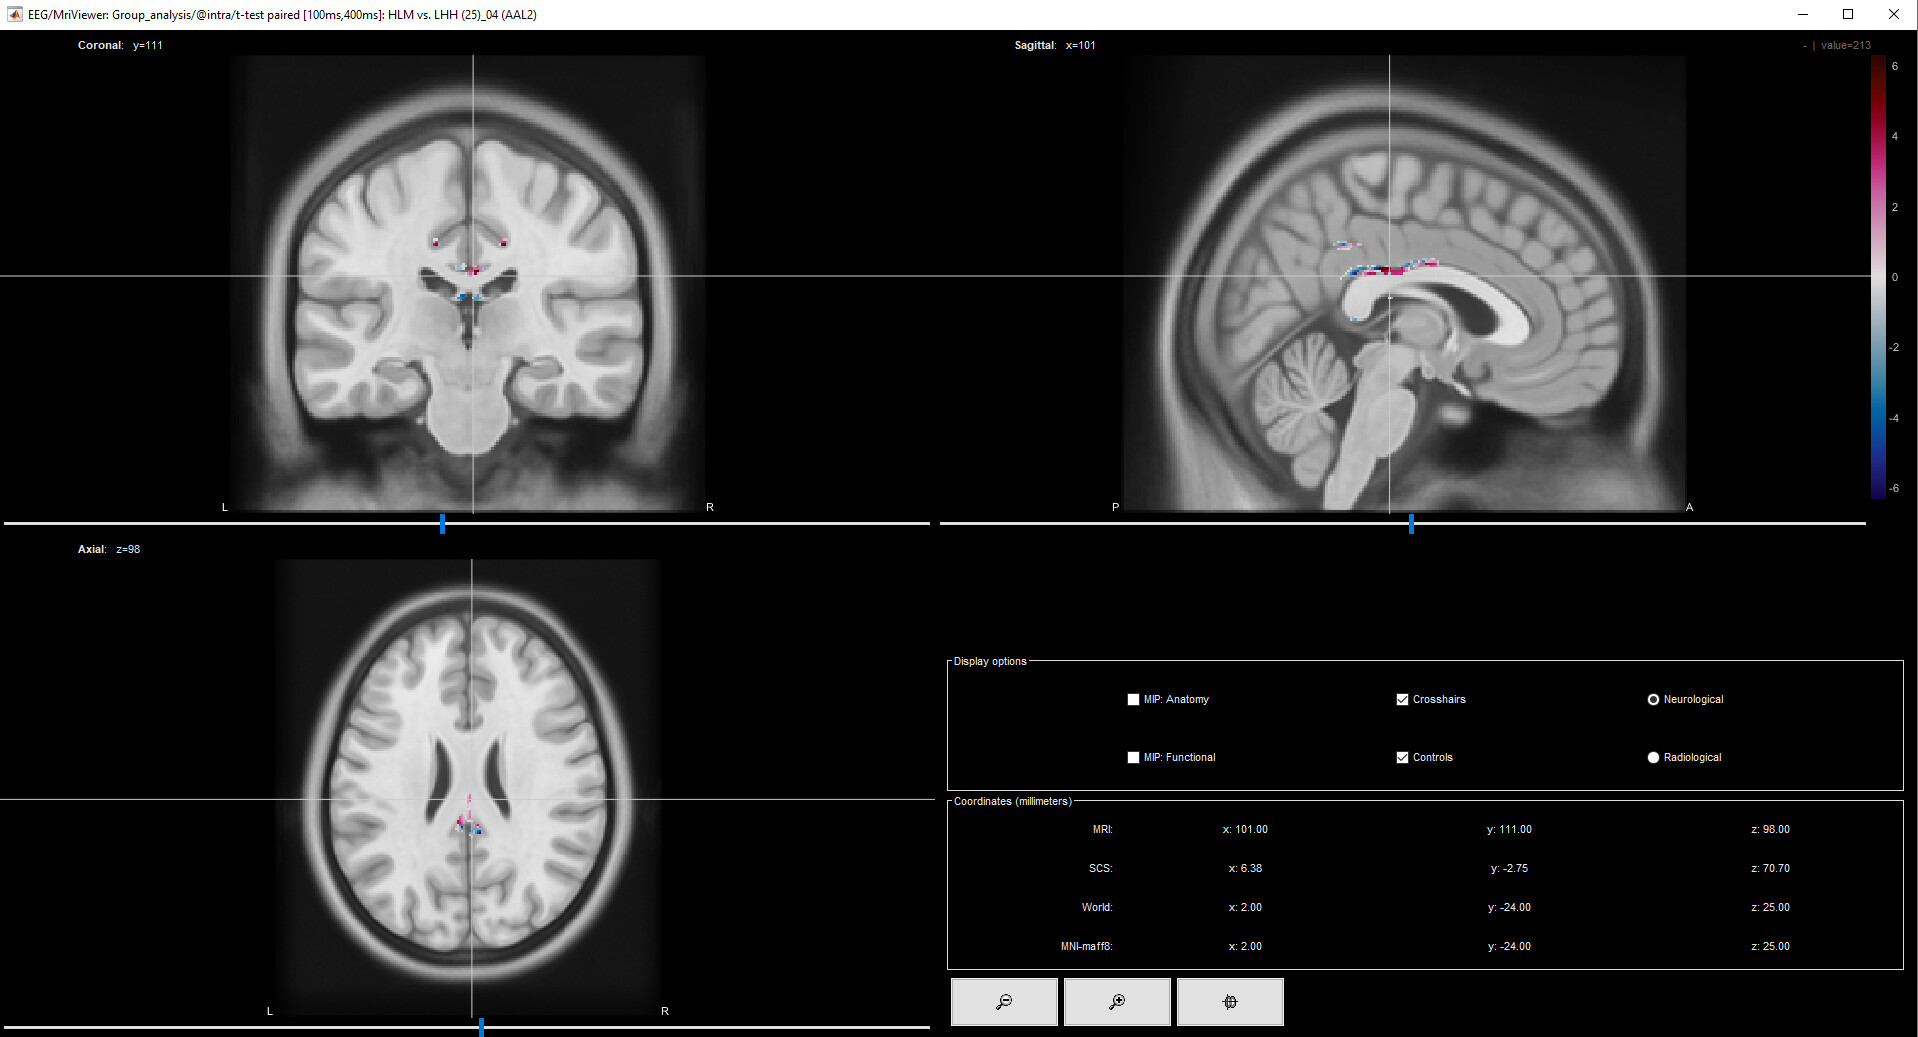
- I found the main difference between the two conditions in a very deep location (which is wired considering that the solution adopted for the inverse problem, i.e., the unweighted MNE, should emphasize cortical activations)
- Such brain area presents both positive and negative t within a very small region (meaning that it should be more (and less) activated at the same time for the same experimental condition).
I have attached an image of the result obtained with the parametric test. Do you have suggestions about the pipeline or comments about the plausibility of the results?
Thank you very much for the help!
Paolo