Hi,
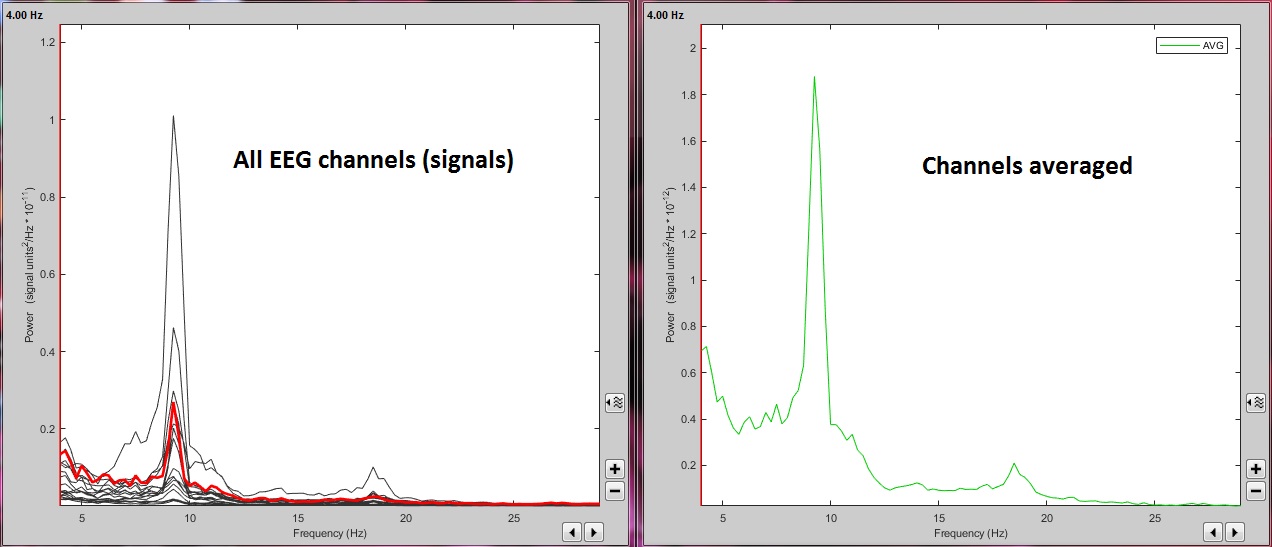
I calculated the power (Welch method), then extracted the specific frequency band and averaged the channels, selected red line on the left is just Cz:
I wonder why the power values are higher in the averaged plot, I would expect them to be lower in averaged plot.
Thanks
You can see a multiplying factor in the legend on the left of the figure.
Left figure: 10^-11 (maximum = 1 * 10^-11)
Right figure: 10^-12 (maximum = 1.8 * 10^-12 = 0.18 * 10^-11)
Thanks Francois. Is it possible to I make these the same across figures?
Also, scaling values, I can shift to Matlab figure to make scaling numbers the same (e.g. from zero to 2 in both figures) but is it possible to do it without converting to Matlab figure?
No, there is no solution for doing this from the interface.
But this is very easy to do with one line of Matlab code.
To use the vertical scale of the first figure for all the others:
hAxes = findobj(0, 'Tag', 'AxesGraph'); set(hAxes, 'YLim', get(hAxes(1), 'YLim'));
To set it to a fixed value:
hAxes = findobj(0, 'Tag', 'AxesGraph'); set(hAxes, 'YLim', [0, 1e-11]);