Time window issue with epileptogenicity index method

Dear Francois,

I tried to run the Epileptogenicity process on one of my seizures, following the instructions in the tutorial, however using different latencies: I first imported a 15-sec baseline, and a 50-sec seizure epoch, consisting of -10 sec prior to onset (preictal) and 40 sec after (ictal). I used various latency strings using some frames with negative time window values ('-10:2:36','-10', '-10:2:-2'); when I did this, I either got this error,

** Error: [process_epileptogenicity]  Epilepsy > Epileptogenicity maps (A=Baseline,B=Seizure)
** Line 212: Index exceeds array bounds.
** 
** Call stack:
** >ImaGIN_Epileptogenicity.m at 212
** >process_epileptogenicity.m>Run at 277
** >process_epileptogenicity.m at 28
** >bst_process.m>Run at 231
** >bst_process.m at 36
** >panel_process2.m>RunProcess at 150
** >panel_process2.m at 26
** >gui_brainstorm.m>CreateWindow/ProcessRun_Callback at 772
** >bst_call.m at 28
** >gui_brainstorm.m>@(h,ev)bst_call(@ProcessRun_Callback) at 296

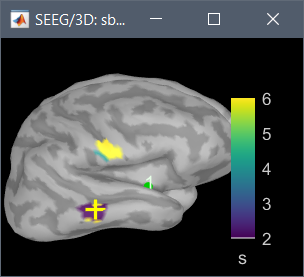
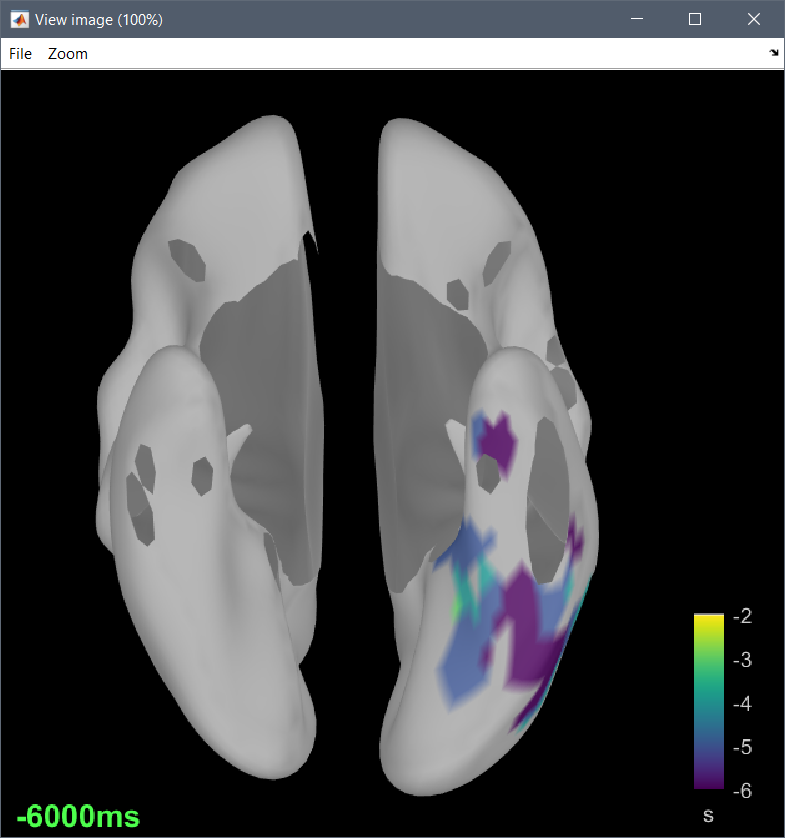
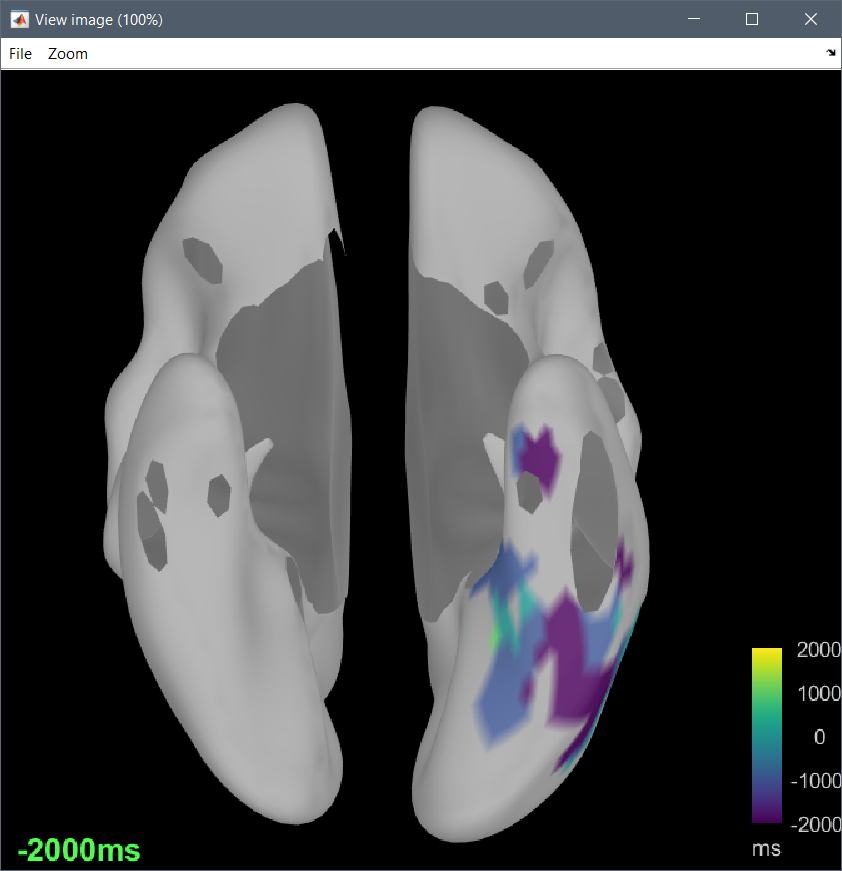
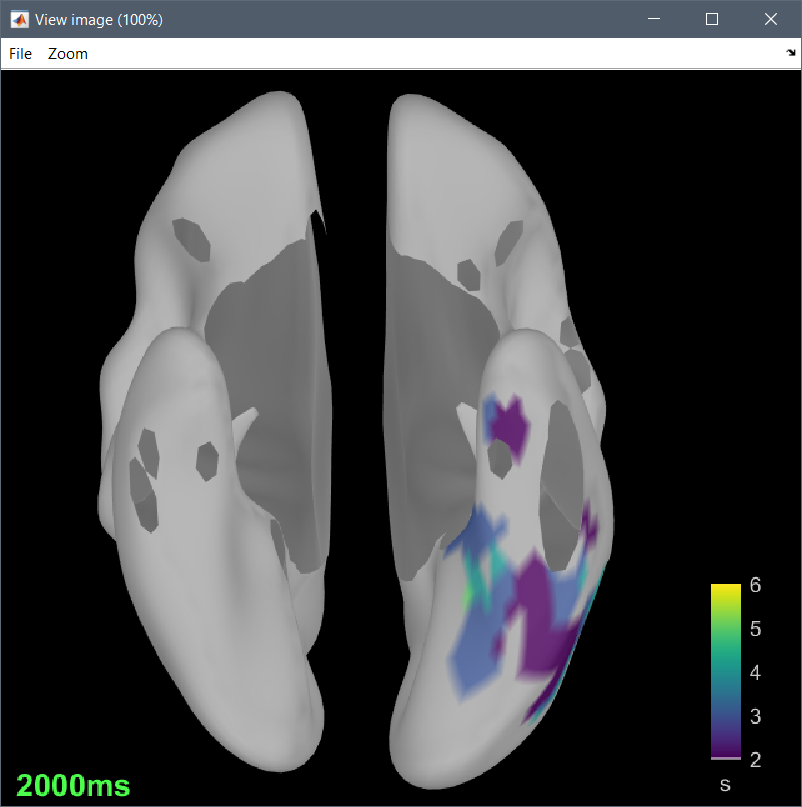
or I got through, but the delay map pictures start at frame 0, instead of -10. It seems that the code is built to analyze seizures from frame time 0 and on.

It would be desirable to adjust the code to be able to accommodate negative frame times (prior to seizure onset (0sec) time; otherwise, one would have to add markers at (mrk = eo - 10 sec) in the raw link file, then import in database using mrk+ 50 sec, which is doable but takes some time if one has 15 seizures to process per subject (with my recordings, I can assume this is not singular, the seizure onset marker eo was added in the original file, prior to import into Bst). It would be more natural to keep seizure onset as time/frame 0 sec, import a -10:40 sec epoch into database, then run the code maintaining this time window designation. The reason one does not want to start with t=0 sec at times is that there is some uncertainty or interrater divergence (in some cases) as to where the clinical seizure onset is, so one may want to see the ictal discharge in evolution, with some buffer pre/post onset.

I think the main change would be starting a line 198 in imaGIN_Epileptogenicity.m, as follows:

>     for i0 = 1:size(DD,1)
>         if (length(Horizon) == 1)
>             TimeWindow = min(latency(:)) : TimeResolution : Horizon+1+max(latency(:));
>         elseif (length(Horizon) > 1)
>             TimeWindow = min(latency(:)) : TimeResolution : Horizon(i0)+1+max(latency(:));
>         end

with min(latency(:)) replacing 0.
There may also need to be some other minor downstream changes, since the picture of the delay map still shows a legend 0:36 sec, as opposed with -10:36, after the modification above.
I will attach a subject's folder via email with one baseline and seizure epoch as described above, please try it with latencies as above ('0:2:36','-10:2:36','-10', '-10:2:-2') to see what I am talking about.
Thank you much, as always,

Octavian

Dear Octavian,

Indeed, the epileptogenicity process was not capable of processing negative time values.
I tried to fix this issue in this commit: https://github.com/brainstorm-tools/brainstorm3/commit/cee9839baa79644522c0f123f917551176615a2d
Update Brainstorm to get this fix. There might be additional issues related with these negative time points in the ImaGIN_* functions, be careful.

Thank you for reporting this problem and suggesting a solution.
Francois

@odavid FYI: We pushed modifications to ImaGIN functions on the Brainstorm repository.
You might want to report these fixes on your repositories as well.

Dear Francois,
Thank you!

I ran the subject I sent you with a latency of -10:2:-2, and then with latency 'slices' of -10, -8, .., -2, to verify output. Same thing with 0:2:4 vs 0,2,4; both 'surface' mode. Here is what I found.

1.The imaGIN_Epileptogenicity.m output seems ok as far the the EI maps; I compared the -10:2:-2 serial time contact sheets with the 'slice' EI maps, and those are identifcal (minus the t map thresholding, which is based on the max of each file)
2. The issue seems to involve the Delay maps. First, the legend for the -10:2:-2 series map is incorrect (bounds [-10,-8], instead of [-10,-2]), and stems from the time vector included in process_epileptogenicity.m line 367,
tmpFile = import_sources(iStudy, [], bst_fullfile(workDir, listFiles(i).name), [], fileFormat, Comment, 's', [fileLatency(1), fileLatency(end)]);
A fix is to change it to
tmpFile = import_sources(iStudy, [], bst_fullfile(workDir, listFiles(i).name), [], fileFormat, Comment, 's', [min(fileLatency(:)), max(fileLatency(:))]);

This is because the way the neg indices change the order of read, therefore iFiles, and fileLatency variables. Want to make sure that the order of the time slices/latencies is temporally correct.

  1. This is not all regarding the Delay maps. Whether it is -10:2:-2 or 0:2:4, there is an inconsistency in the maps between Delay and EI Time contact sheet for the exact times included in the Delay. They should be identical. I do not think this is a thresholding issue between the two. I here attach the -10:2:-2 delay (mesial, interhemispheric surface) and the 'mesial' time contact sheet, to see the difference (there is a high-intensity/high t blob at -10 sec on the EI maps, not seen in the Delay map. Again, this discrepancy involves both negative or positive latencies, so this precedes my request.
  2. Only partly related, it would be probably helpful to include the numerical min, max-es of these map figures somewhere in the colormap menus, that way one can adjust the colormap scale among various serial vs slices, Delay vs EI maps for correspondence. Also, deleting the .brainstorm/tmp folder after a run automatically may help clean things up before another run, if one attempts to do it serially without exiting and entering bst repeatedly (it probably does not affect the results, but trying to avoid confounders).

Thank you,
OctavianContact_sheet__stat_3D_sbj_Epileptogenicity_surface_33_-10_-2_med.tif (115.3 KB) SEEG_3D_sbj_Epileptogenicity_surface_-10_-2_Delay.tif (297.7 KB)

Can you take a look at these issues? It would be nice to get a resolution, thank you (maybe OD can also get involved). Octavian

Fixed: Bugfix: Epileptogenicity and delay display · brainstorm-tools/brainstorm3@32cc924 · GitHub
Thanks for the suggestion!

This is not all regarding the Delay maps. Whether it is -10:2:-2 or 0:2:4, there is an inconsistency in the maps between Delay and EI Time contact sheet for the exact times included in the Delay. They should be identical.

Not necessarily. Olivier David's code keeps only the vertices that show a significant increase wrt baseline in at least two consecutive time steps. At latency #i, it erases all the vertices that were not significant at latency #i-1:
brainstorm3/external/ImaGIN/ImaGIN_Epileptogenicity.m at master · brainstorm-tools/brainstorm3 · GitHub

If you have a very significant peak of activity at t=-10 that is not present anymore at t=-8, it woulnd't appear in your final delay maps.
@odavid Can you please confirm this is what you intended to do?

I modified a bit the description of the method in the Brainstorm tutorial to include this restriction: https://neuroimage.usc.edu/brainstorm/Tutorials/Epileptogenicity#Surface:_Seizure_2.2F3

While exploring all this, I found a few bugs in the way the FDR thresholding was done in the Brainstorm when displaying the EI maps. The same FDR correction was applied for all the latencies in Brainstorm, while in ImaGIN_Epileptogenicity, it was computing a different FDR threshold for each latency to build the delay map. This is now fixed, existing results must be recomputed. This has no impact on the delay maps.

deleting the .brainstorm/tmp folder after a run automatically may help clean things up before another run, if one attempts to do it serially without exiting and entering bst repeatedly (it probably does not affect the results, but trying to avoid confounders).

Done: Bugfix: Epileptogenicity and delay display · brainstorm-tools/brainstorm3@32cc924 · GitHub

Only partly related, it would be probably helpful to include the numerical min, max-es of these map figures somewhere in the colormap menus, that way one can adjust the colormap scale among various serial vs slices, Delay vs EI maps for correspondence

If you want a value anywhere on the cortex, you can create a scout a plot its value (you'd get a time-resolved signal for the EI maps with multiple latencies) or you can right-click on the figure > Get coordinates.
image image

I also identified and fixed a few bugs related with the colormaps with negative times. If you don't see the min and max colors clearly matching your latencies (as in the figure above), let me know, there might be additional things to fix.

Many thanks, Francois! I will give it a try and let you know. Octavian

image
image

Dear Francois, I tested the neg time window issue by using a group of three seizures. Photo 1 shows the result using negative time frames (-10:40 for the seizure epochs, map command: -8:2:16), and photo 2 shows the processing with positive time frames for the same seizures (frames transposed +10 sec (0:50), by modifying the database epoch mat Time variable, Time = Time +10; then saving it modified in the database; map command: 2:2:26).
Reassuringly, the group delay maps look identical as far as scout topology, but shifted in the colormap position (where they should also be identical), any thoughts? Thank you,
Octavian

While investigation this problem, I found a minor bug in the selection of baseline time points, leading some time shifts to skip one of the baseline time points, giving slightly different results when testing for significance.
I fixed it : Bugfix: Epileptogenicity baseline time selection was not robust to ti… · brainstorm-tools/brainstorm3@b2a10bc · GitHub

@odavid Maybe you'd like to report this to the ImaGIN repository.

However, I could not find a way to reproduce the behavior you described here. I used the Epileptogenicity tutorial dataset, seizure 1, compute the delay maps for -2:1:2 and shifted it by -4s and +4 (both the Time vector in the Onset files and the Lacency option in the process). I obtained exactly the same maps, displayed exactly in the same way.


Can you start by recomputing carefully what you did to make sure you didn't to any manipulation error?

Could you illustrate this on the Epileptogenicity tutorial dataset? (if you still have it on your computer)?

Is this an error in the delay map files (you can check the actual values by right-clicking on the figure > Get coordinates) or a colormapping error (the time values are correct but incorrectly mapped to the colors)?