Fixed: Bugfix: Epileptogenicity and delay display · brainstorm-tools/brainstorm3@32cc924 · GitHub
Thanks for the suggestion!
This is not all regarding the Delay maps. Whether it is -10:2:-2 or 0:2:4, there is an inconsistency in the maps between Delay and EI Time contact sheet for the exact times included in the Delay. They should be identical.
Not necessarily. Olivier David's code keeps only the vertices that show a significant increase wrt baseline in at least two consecutive time steps. At latency #i, it erases all the vertices that were not significant at latency #i-1:
brainstorm3/external/ImaGIN/ImaGIN_Epileptogenicity.m at master · brainstorm-tools/brainstorm3 · GitHub
If you have a very significant peak of activity at t=-10 that is not present anymore at t=-8, it woulnd't appear in your final delay maps.
@odavid Can you please confirm this is what you intended to do?
I modified a bit the description of the method in the Brainstorm tutorial to include this restriction: https://neuroimage.usc.edu/brainstorm/Tutorials/Epileptogenicity#Surface:_Seizure_2.2F3
While exploring all this, I found a few bugs in the way the FDR thresholding was done in the Brainstorm when displaying the EI maps. The same FDR correction was applied for all the latencies in Brainstorm, while in ImaGIN_Epileptogenicity, it was computing a different FDR threshold for each latency to build the delay map. This is now fixed, existing results must be recomputed. This has no impact on the delay maps.
deleting the .brainstorm/tmp folder after a run automatically may help clean things up before another run, if one attempts to do it serially without exiting and entering bst repeatedly (it probably does not affect the results, but trying to avoid confounders).
Done: Bugfix: Epileptogenicity and delay display · brainstorm-tools/brainstorm3@32cc924 · GitHub
Only partly related, it would be probably helpful to include the numerical min, max-es of these map figures somewhere in the colormap menus, that way one can adjust the colormap scale among various serial vs slices, Delay vs EI maps for correspondence
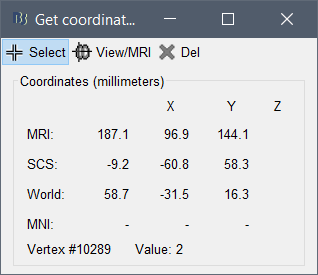
If you want a value anywhere on the cortex, you can create a scout a plot its value (you'd get a time-resolved signal for the EI maps with multiple latencies) or you can right-click on the figure > Get coordinates.
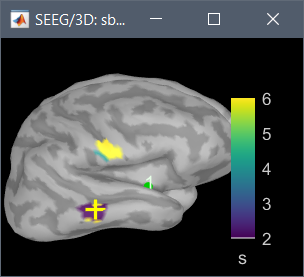
I also identified and fixed a few bugs related with the colormaps with negative times. If you don't see the min and max colors clearly matching your latencies (as in the figure above), let me know, there might be additional things to fix.