Hello,
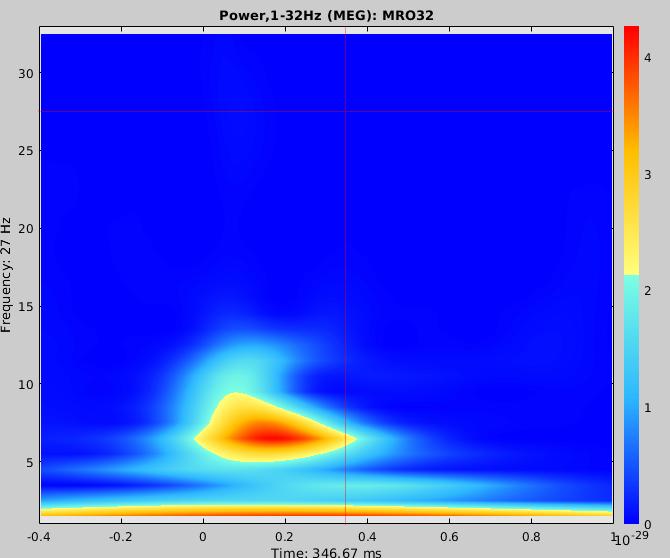
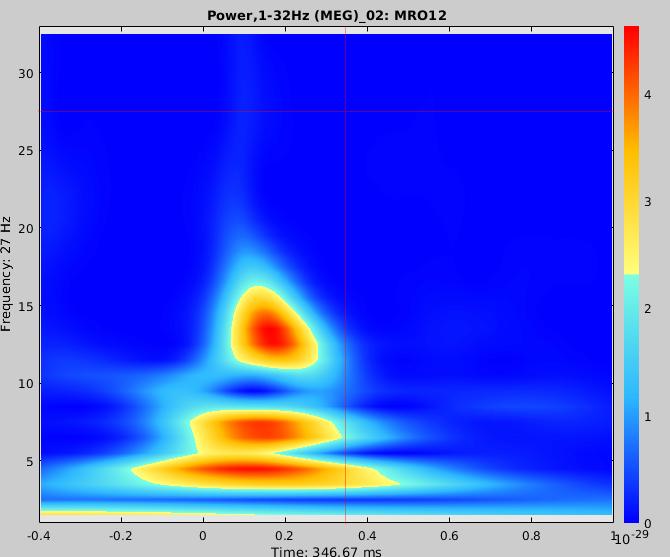
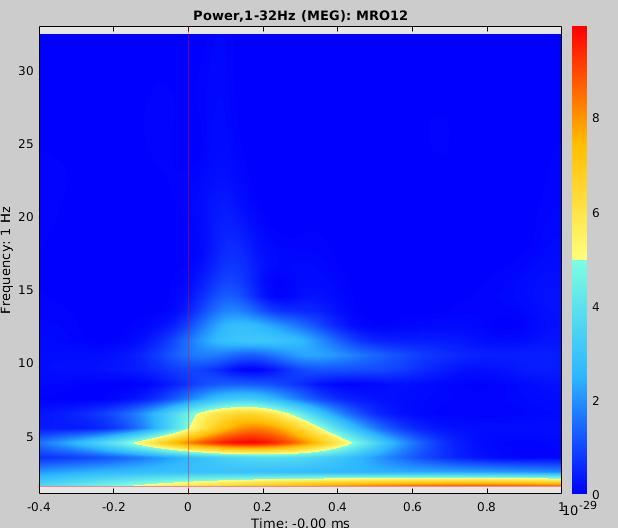
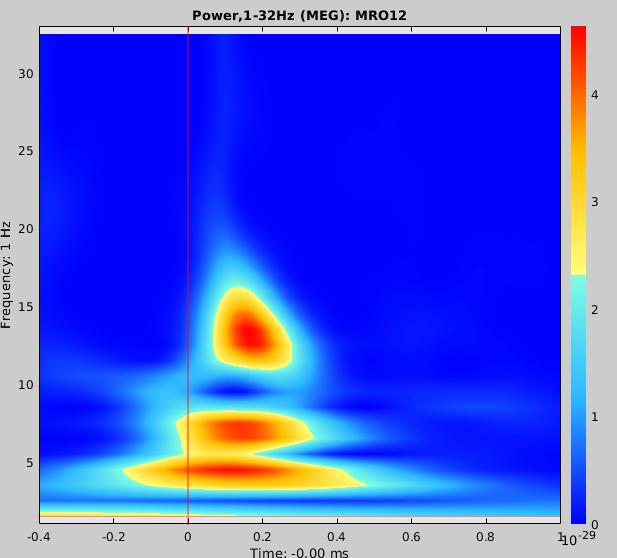
I want to compare two time-frequency plots between-groups (controls vs OCD group) for the same MEG sensor but I'm not sure how to scale the color bar. It seems I can only get identical color bar values if I change sensors. Please see images attached. I want to compare MRO12 in controls to MRO12 in OCD.