Hello,
I am trying to compare 2 conditions (each from 20 people) using papametric T test. Looking at average plots from 20 people it is possible to see strong difference over the left prefrontal region and I would excepct it to be significant. But when I run the test I get the difference for unexpected regions. What can be the reason?
Thanks
What test are you running?
With which options?
On what type of data?
And what do these various figures represent?
That is EEG data, brain potentials in response to painful stimuli.
I did Morlet transform on sources (-100 ms +400 ms, 60-100 Hz) for each trial, 20 people, 2 conditions at once (20 people per condition, 21 trials per condition), then I averaged them by folder and got 20 source transforms per condition and run t test on them.
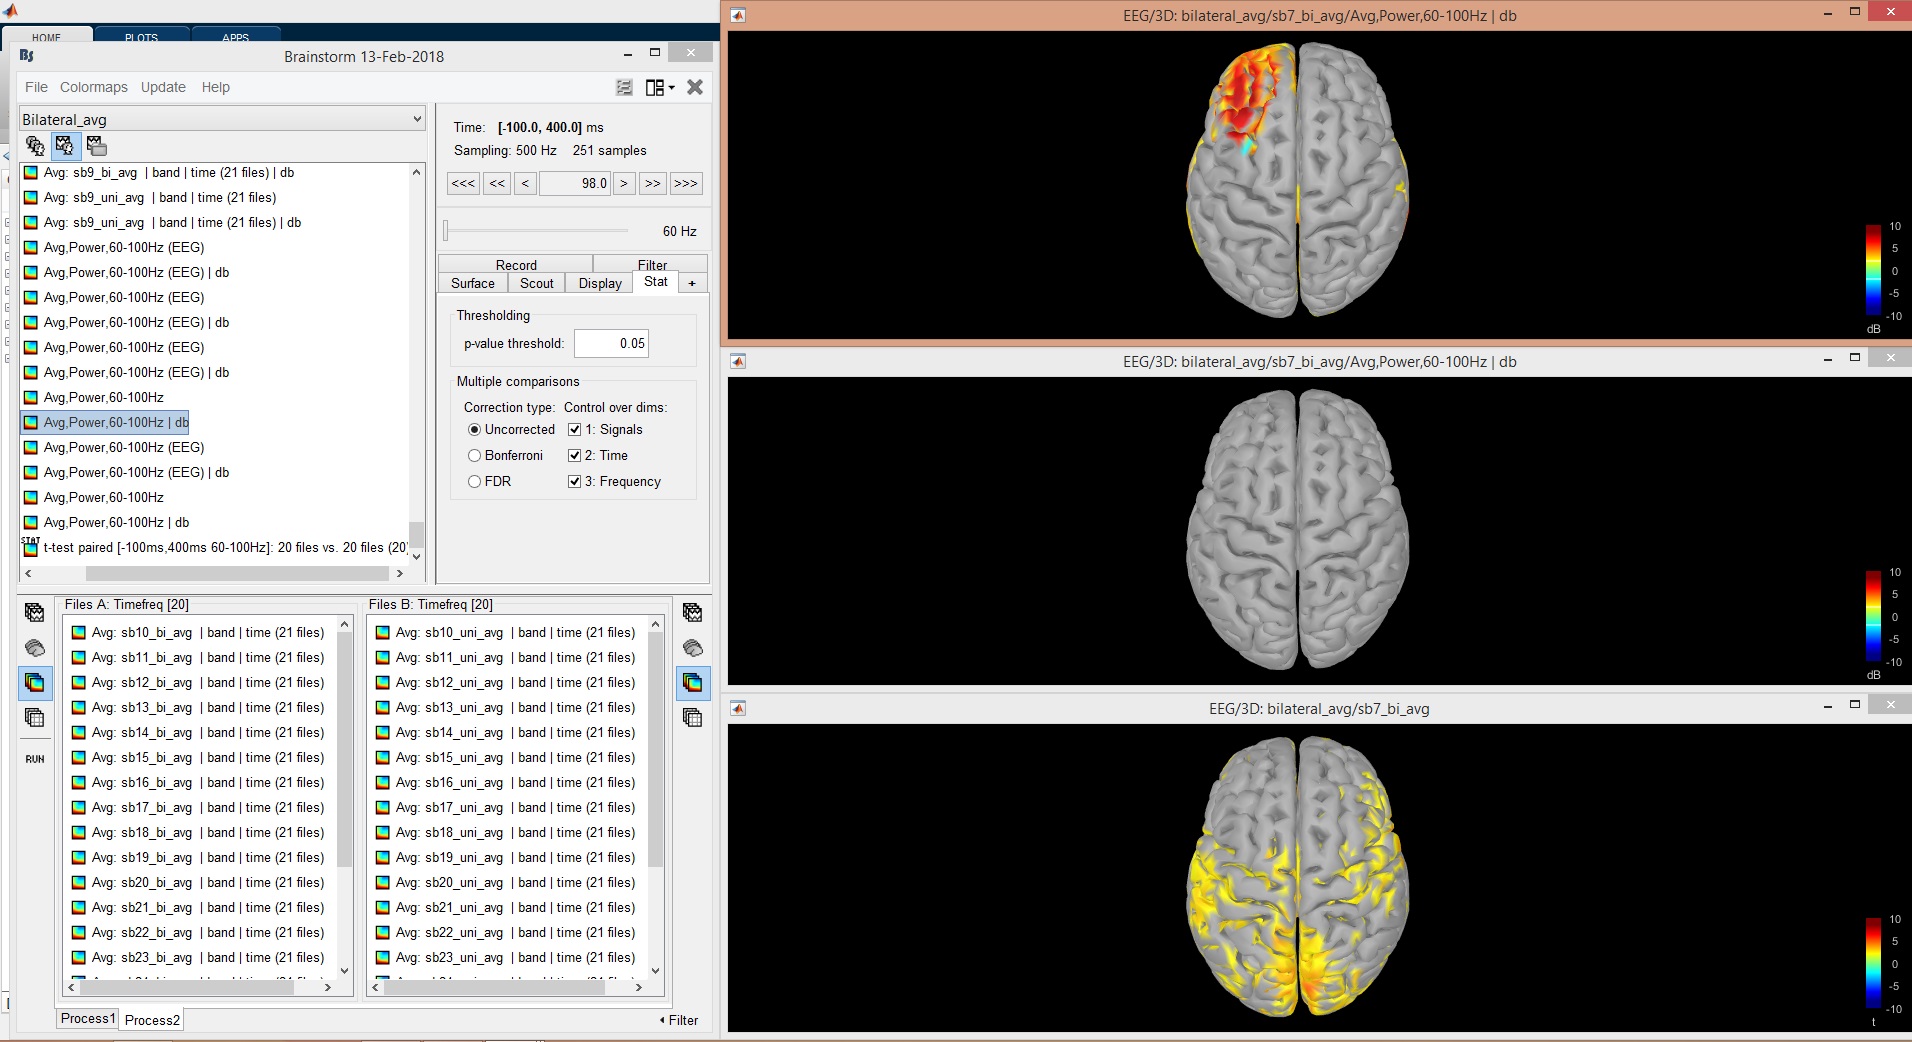
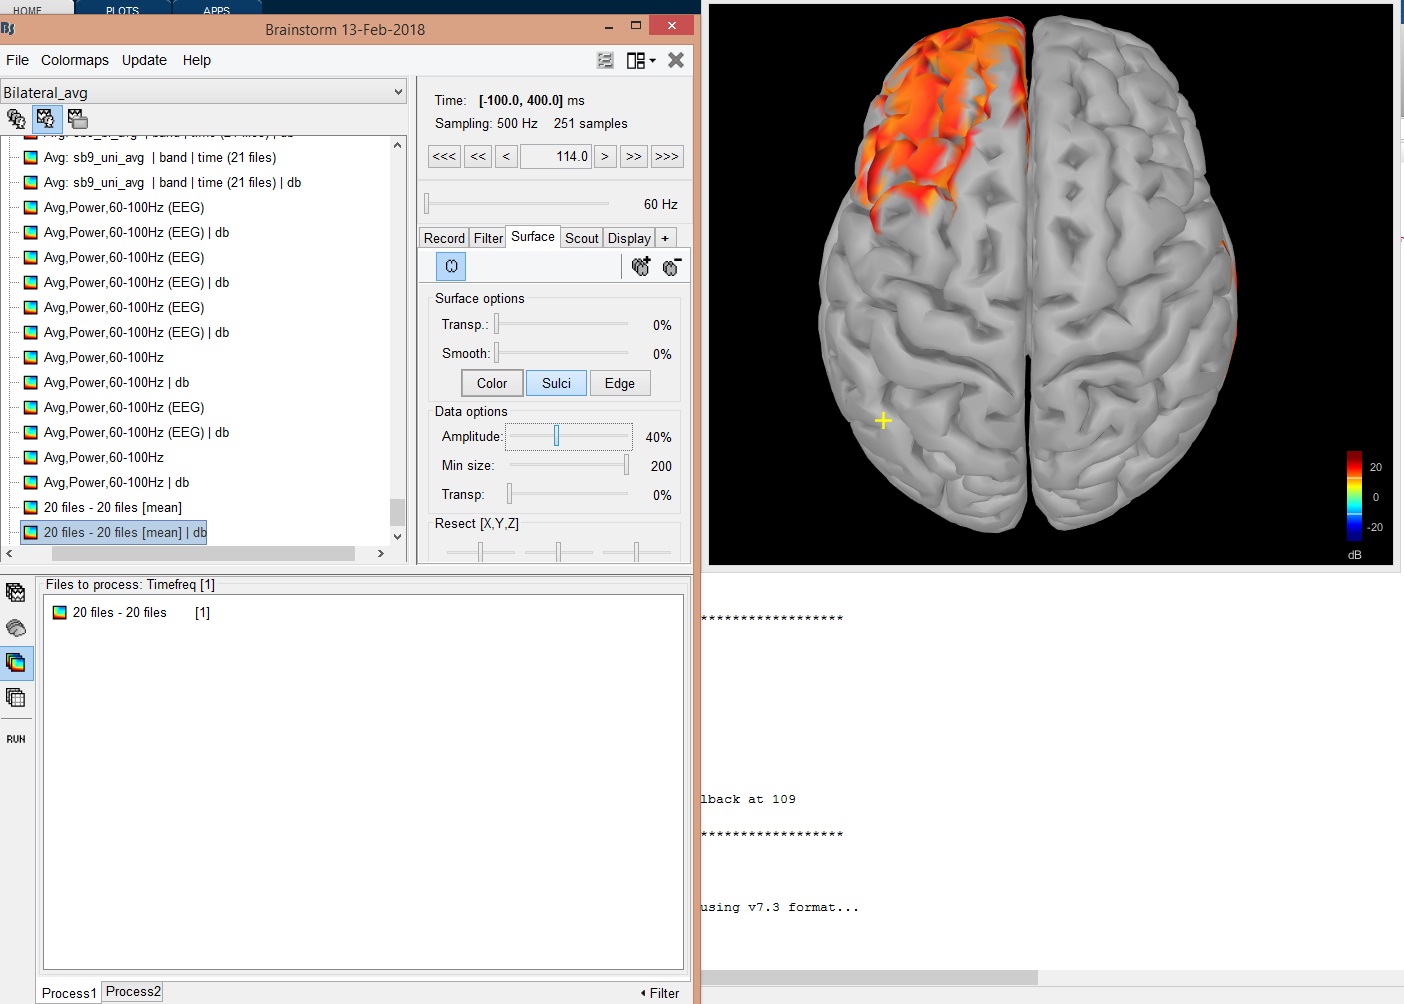
In above message, Figure 1: top is average condition 1 over 20 people, in the middle average condition 2 over 20 people, in the bottom t test result. Figure 2, difference of mean between condition 1 and 2 (20 people per condition).
T test parameters I used:
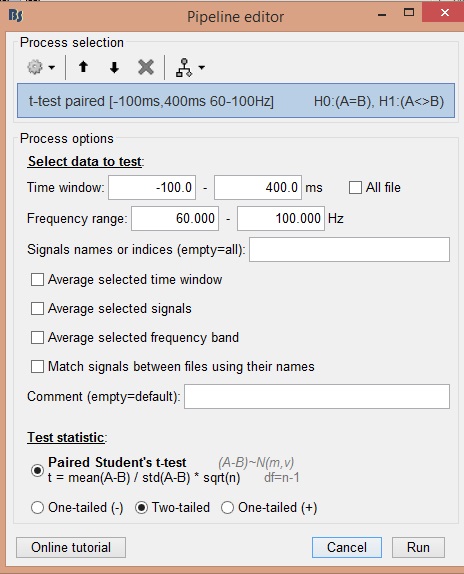
I have no idea what the issue could be. The difference of average and t-test results should indeed look alike.
I would need to have the data in head to test it further…
Could you try to assemble a simple example case and send it to me?
For instance: create a new subject, use the same anatomy as for the other subjects, create two new folders (one per condition), and copy all the files you test (no need to include the 20 subjects if you can reproduce the behavior with only a few).
Then right-click on the subject > File > Export subject, upload the .zip file somewhere and post the link to download it here or send it to me via private message on this forum.
Btw, you could probably optimize your pipeline: saving the TF analysis for all the trials at the source level is probably very slow and use crazy amounts of space on your hard drive. You could run the Morlet decomposition for each subject and each condition separately, and average the output on the fly. This would require some scripting so that you don’t have to run this manually 40 times though.
Thanks
Francois
Thanks Francois, I will prepare that and send to you. Thanks for help.
Hello Francois
I selected the region of interest in the hotspot (scout) and run statistics. Here is the result:
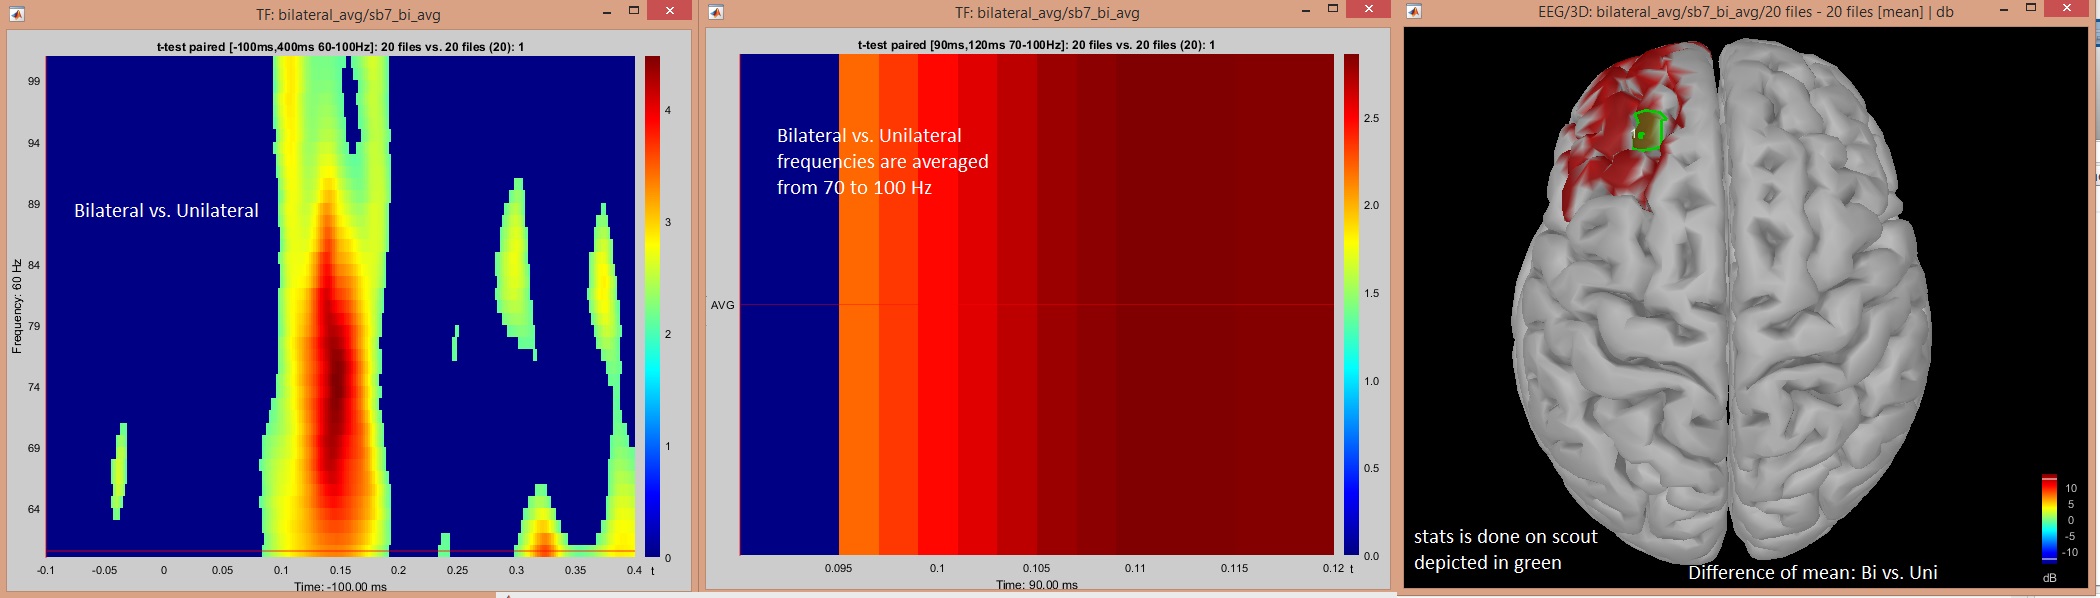
But when I do statistics for whole brain I did not get statistical difference over hotspot (Fugures in previous messages above).
Thanks
Hi Francois, I updated my brainstorm, for the first time. Now t-test on TF-sources is fine.
Thanks
Hello Francois
I updated my brainstorm, for the first time. Now t-test on TF-sources is fine.
Thanks,
Nabi Rustamov