Difference maps vs. t-tests for PSD source and scout data

Hello

I've got some confusing results which I was hoping someone might be able to shine a light on for me.

I've been looking at comparing different conditions, both in terms of sensor data and source data. I have 8 conditions, up to 4 trials each.

For the sensor data, I computed PSDs on the trials in frequency bands, and then averaged these for each participant (Average everything -> arithmetic average, with the "exclude flat signals from the average checked). I then normalised the average PSD file through spectrum normalisation -> relative power (because this is what is advised for the source data, so I wanted to be consistent).

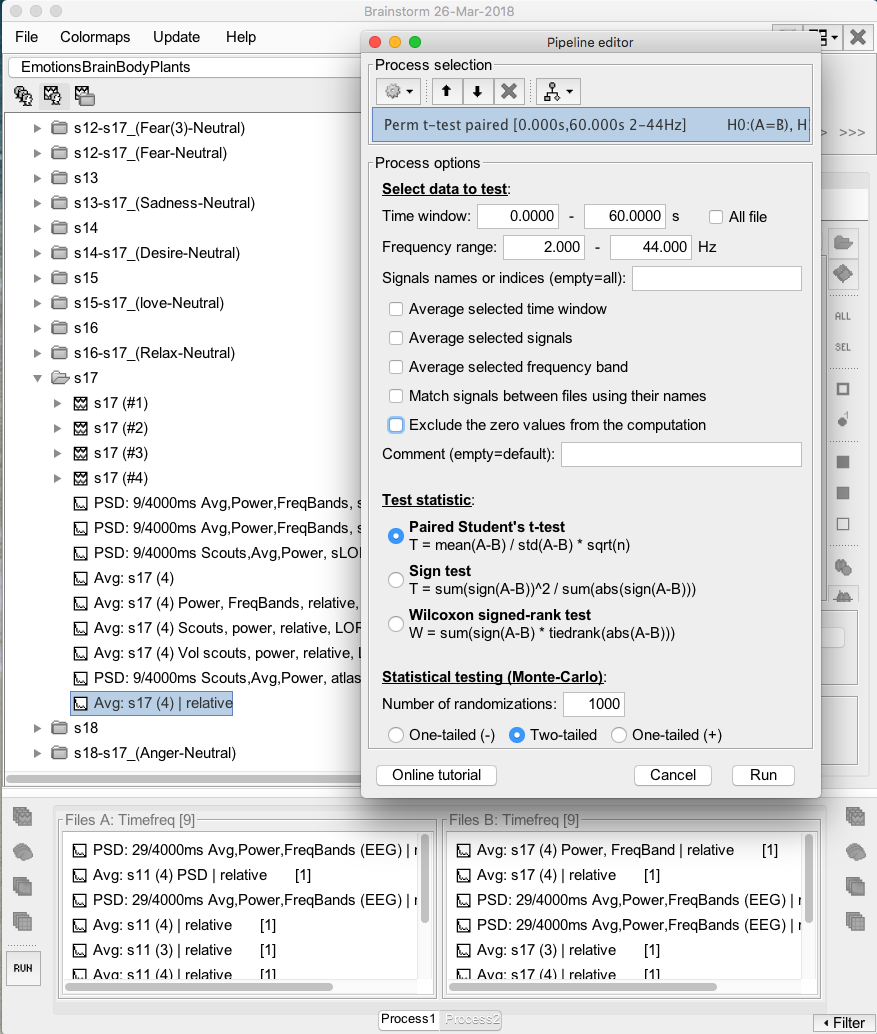
For the between participant analysis I then either performed a permutation t-test on the averaged PSD files from each participant e.g. t-test(PSD(trialsA), PSD(trialsB)).

For comparison, I also ran a difference of the averaged trials A and trials B from all participants, as per the average(PSD(trialsA)) - average(PSD(trialsB)) instruction in this post: What should be compared in statisctics? - #3 by soltanlou. In other words, for each condition, I averaged the participants' average PSD files to get a group mean.

I was expecting to find the same results, but with different scale bars i.e. t-statistic vs. no units, but I see quite different results for all the frequency bands.

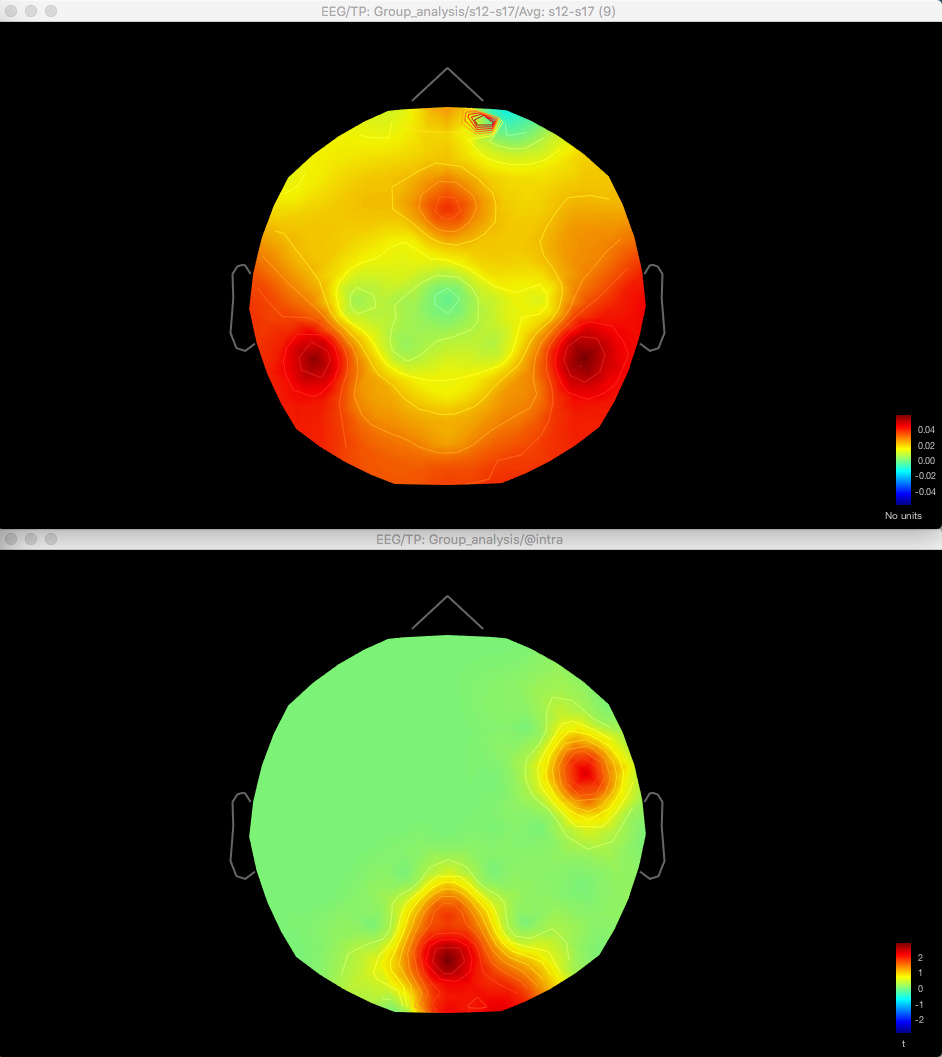
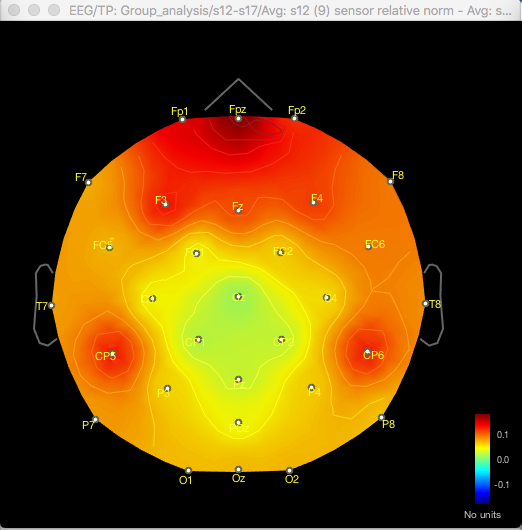
Here's the difference 2D sensor map e.g. for gamma for one contrast:

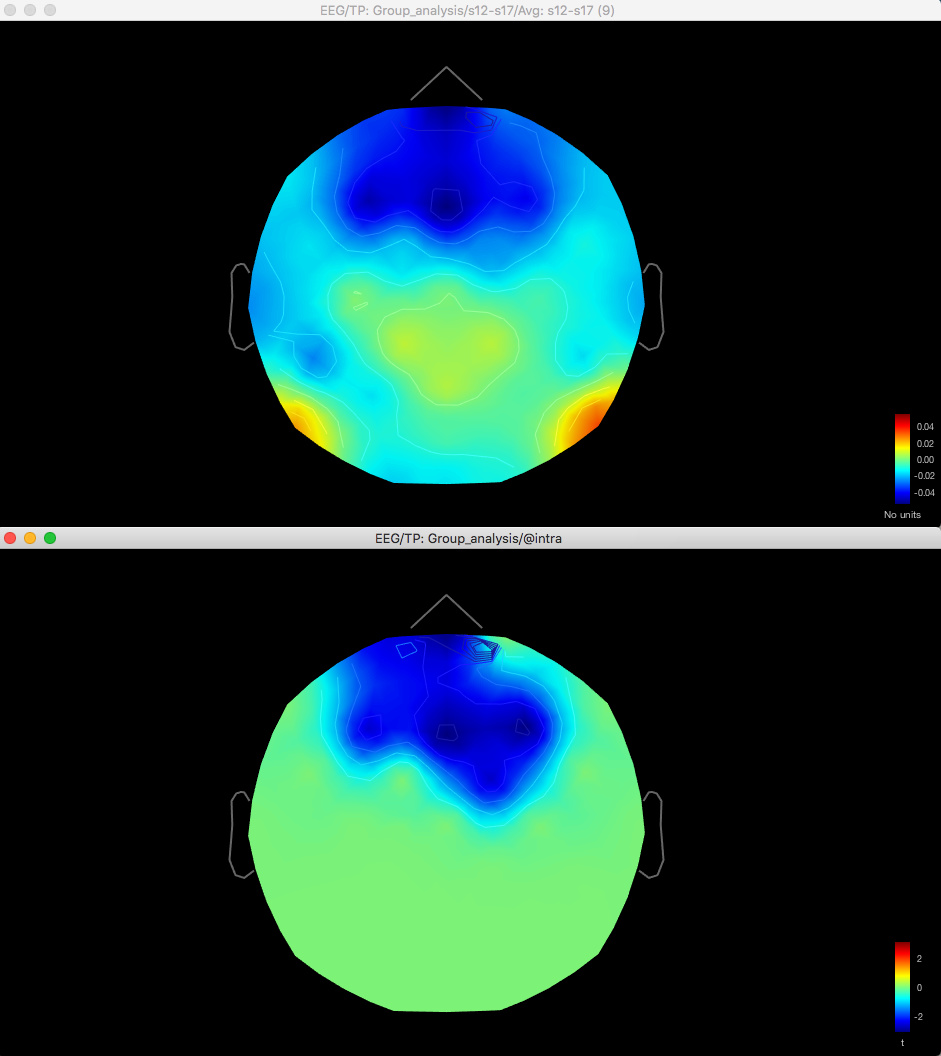
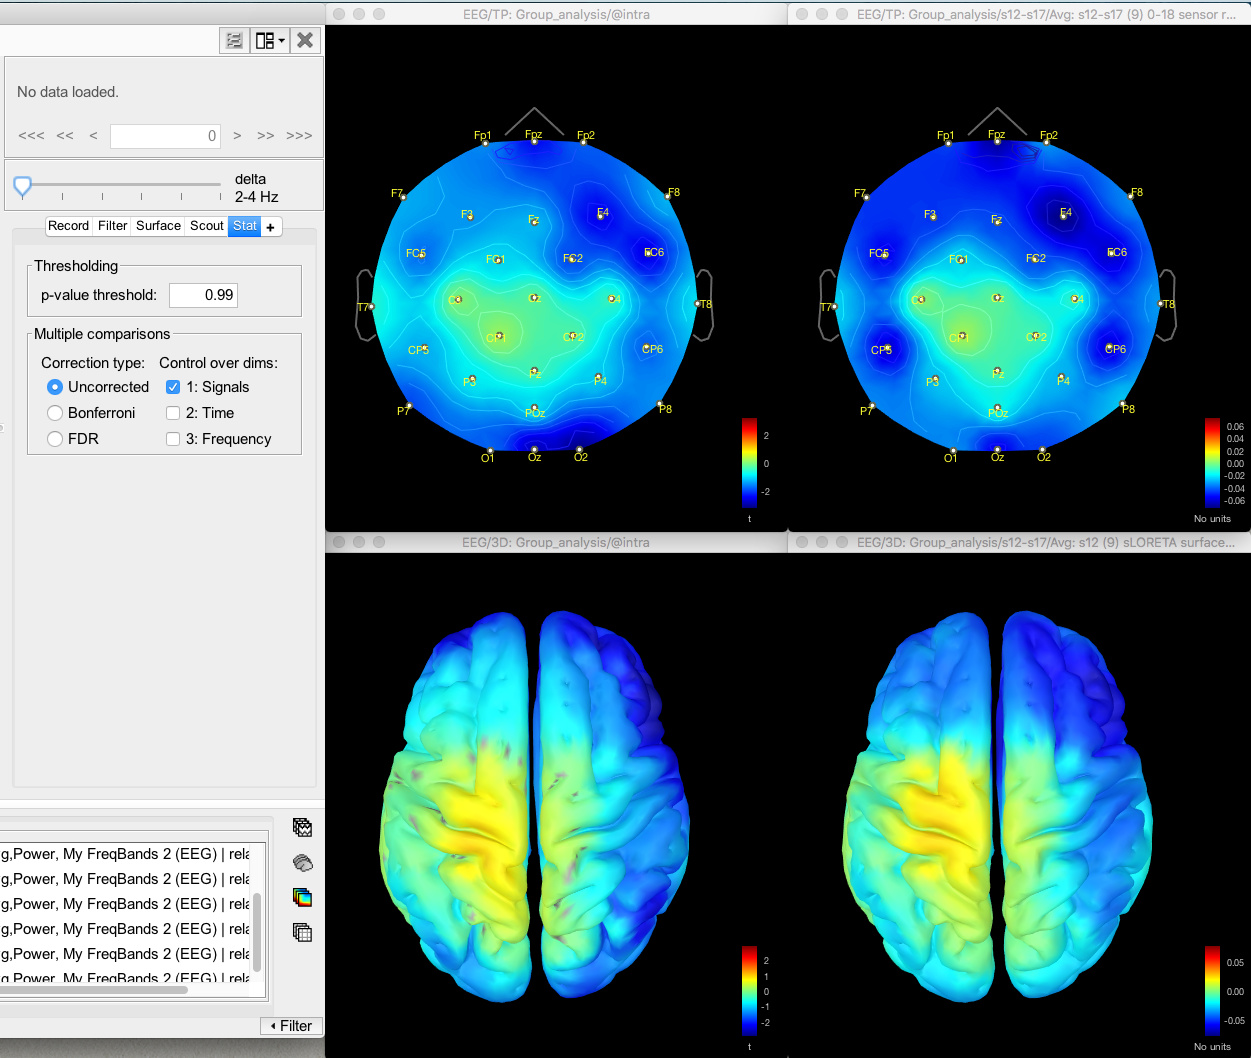
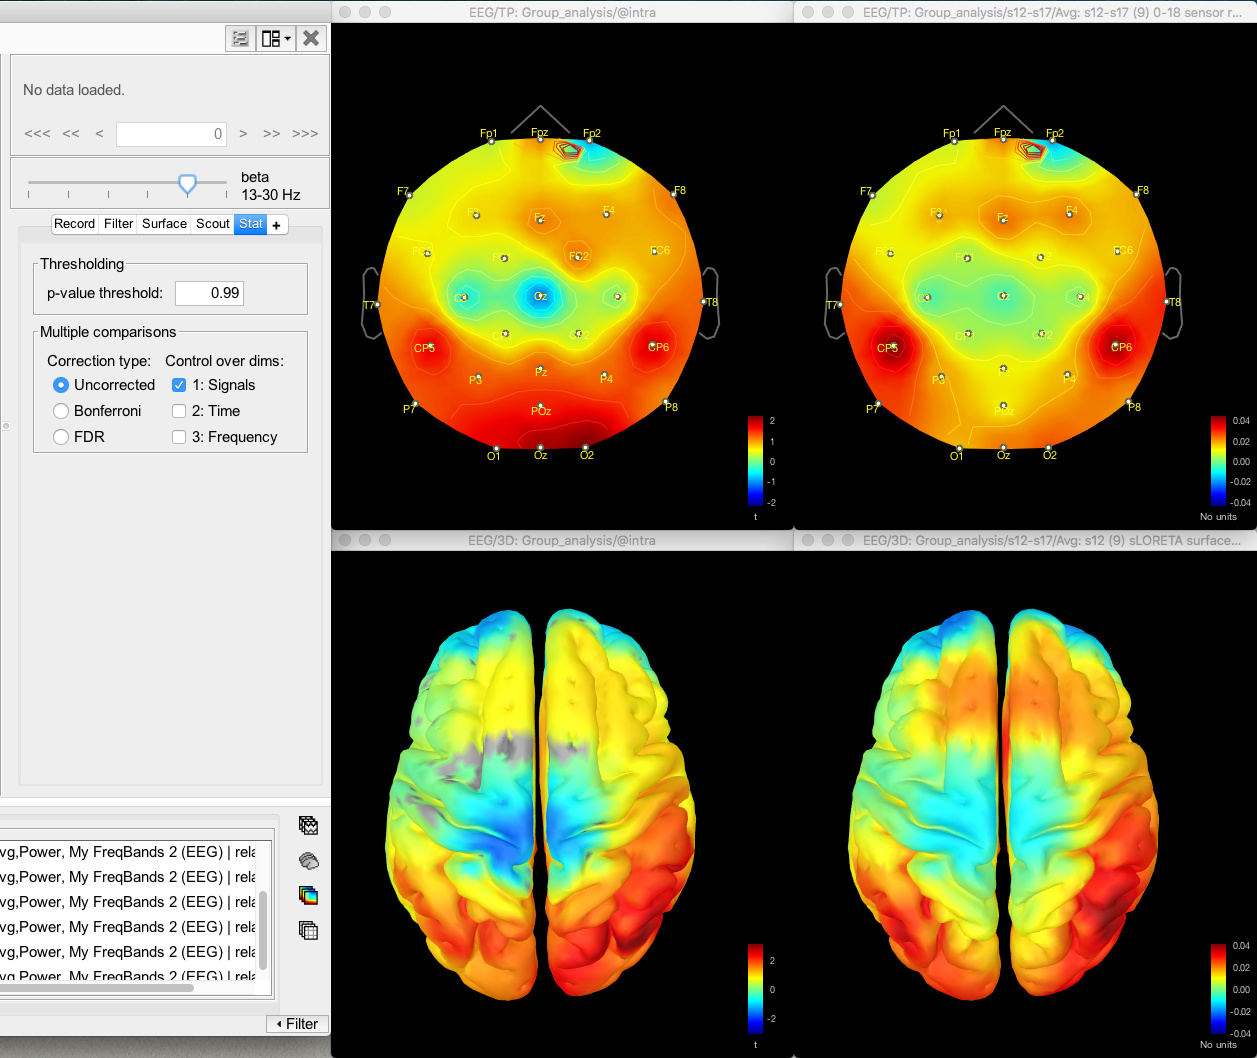
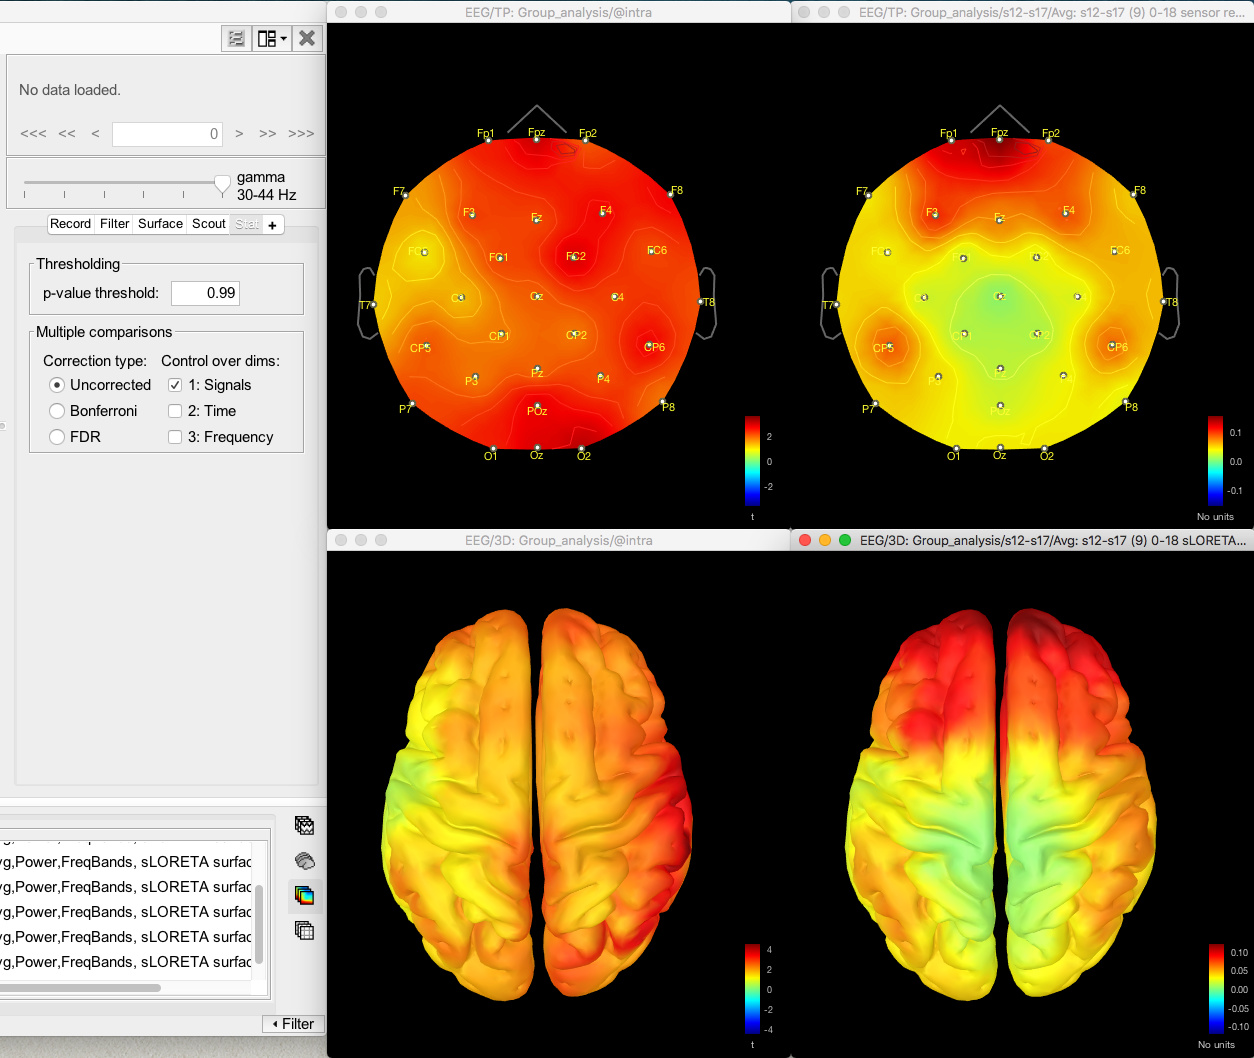
And here's the result of the t-test for the same data for gamma (no multiple corrections applied):

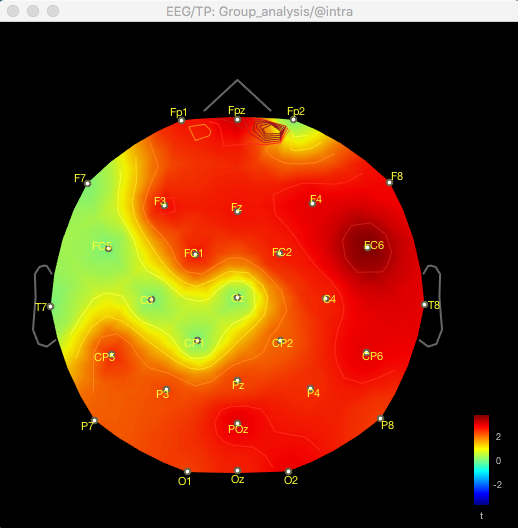
The same discrepancy is seen when I use the same approach for looking at the unconstrained sLORETA surface model source data (on averaged PSD files for each condition from each participant, with the spectrum then normalised to the relative power) - the source data seems to match the distribution of the sensor data for the differences between conditions or for the t-test between conditions, but both give different results.

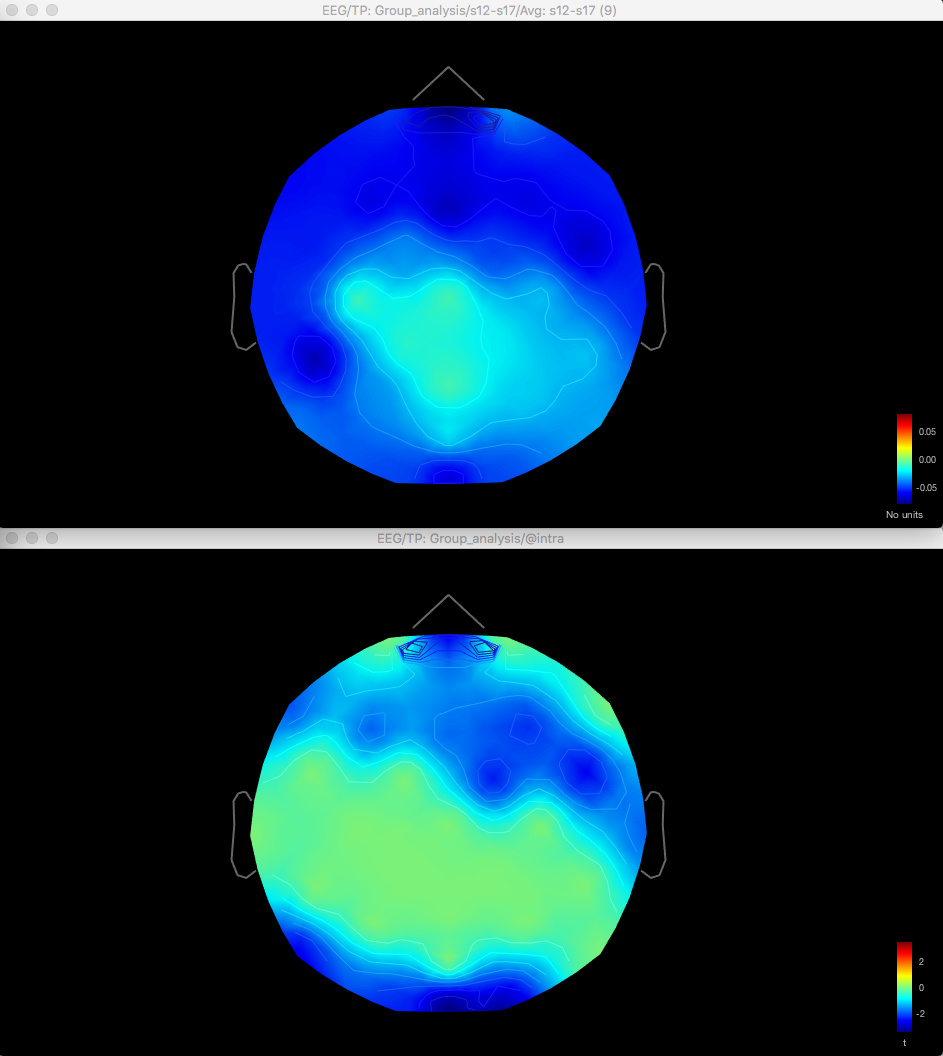
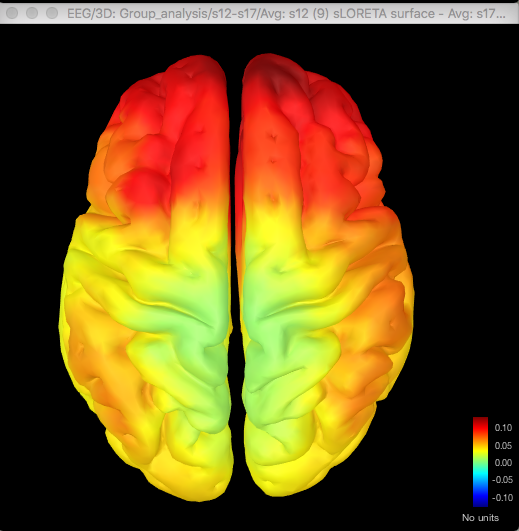
Here's the difference map of the source data, with the same data for gamma as shown above for the sensor data:

Here's the source data for the t-test (no multiple corrections applied):

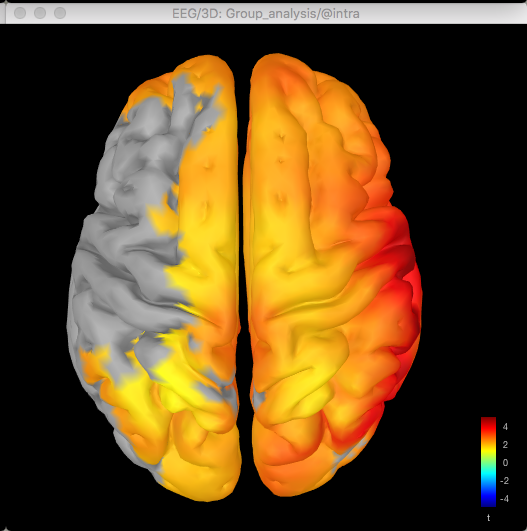
So with the difference maps, the effect seems to be largely frontal and parietal (which is more consistent with my hypothesis), but with the t-test it is more lateralised to the right hemisphere, primarily in the temporal lobe.

When I export the relative power PSD values from the sensor data and run a repeated measured ANOVA in another software program on the different conditions, the significant results that come out match the areas of greater activation in the difference map from the sensor data, rather than the t-test map.

I wondered if it was because I was comparing a parametric test (ANOVA) with a non-parametric permutation test, so I ran a normal paired t-test on the data in Brainstorm, but that looked pretty much the same as the non-parametric test, and still different from the difference maps. So it wasn't that.

Am I missing something obvious?!

Many thanks

Luli

To compare the averages of two conditions across subjects, you should be using a paired test (which has no equivalent with permutations). This corresponds to average_subjects(A-B). See the guidelines in this tutorial:
http://neuroimage.usc.edu/brainstorm/Tutorials/Workflows#EEG_recordings

Nonetheless, the two approaches that you compared are coherent: average(A)-average(B) and t-test(A vs B). I would not expect you to obtain such differences… the topographies of the two should be similar.
How many subjects do you have for each condition?

Four possibilities:

  1. There is some error in the design of your analysis, but I cannot detect it
  2. You added one step that you didn’t document
  3. You did a manipulation error while processing these files: Have you tried starting over?
  4. The results are really expected to look like this, for a reason I don’t know

@Sylvain, @pantazis: Could you please share your interpretation of these differences?

Hi Francois

Thank you for your response.

I did do a paired permutation t-test. I forgot to mention that.

I only have 9 participants - could this be part of the issue? (Unfortunately I had to exclude a number of participants who didn't follow the experiment instructions properly, putting me below the threshold for sufficient participants, so I am just using this data as pilot data with which to learn the ropes.) This is why I didn't activate multiple comparisons - just to see.

I have re-tried the analysis a few times, but not right back to making the individual trial PSD files from the sensor data yet.

However strangely, even if I use the same files in process 2 for the t-test vs. difference, I still get different results. So I can do t-test(A vs B), and get an output from that. Then, with the same files in the process 2 tab, I can do the difference (A-B), and then average all participants. So I get average(A-B), which comes out identical to average(A)-average(B).

These are the settings for the t-test that I used:

I tried the t-tests with the "exclude the zero values from the computation" checked, with or without the "match signals between files using their names" checked, and I got pretty much the same outcome as the other t-test.

The differences seem more pronounced for higher frequencies i.e beta and gamma. Here's the outputs for beta using the above approach, using the same files in process 2, for the same condition difference as my first post (difference shown above, t-test below):

But the differences between theta aren't so great for the same condition difference as above in my first post (difference above, t-test below).

But delta is pretty different:

Thanks again for your time and consideration.

Luli

In these last screen captures, it seems that you applied a threshold on the p values, which you did not in your first post. What do you get if you enter “0.99” as the p-threshold in the Stat tab?
Your file selection looks a bit awkward, why do you have so many different namings for the different files? This seems to indicate not all the files you are trying to compare where processed in the same way…

It’s very difficult to give feedback on such advanced analysis. There are so many things that be done in a wrong way.
If you think there is a bug somewhere in the computation of the t-values, you could try to package an example and send it to us. Create a new subject, copy in two different folders the files you want to test, right-click on the subject > File > Export subject, upload this file somewhere and post the link here, with detailed instructions on how to reproduce the erroneous results.

Hi Francois

I had applied a p threshold of 0.05 in all of the above posts. However when I entered 0.99 as the p threshold, this did resolve most of the differences seen between the t-test results and the difference results, for most of my conditions.

I re-ran the analyses from the start, using a saved pipeline each time, to ensure it wasn't an issue with the processing of the files.

However I still see some differences between the two approaches on a few occasions, in particular at gamma frequencies (and on one occasion, theta). I don't think it can be a bug with the t-test computation, since the other results look the same. And I don't think it can be a problem with my file processing, because the other frequencies within the same condition look the same.

So I think there must be something theoretical going on that I'm not aware of. Could you think of what could cause the gamma frequency results to look different sometimes? The epochs of the trials from which I computed the PSDs were 18 seconds long.

Here's an example of the difference vs. t-test for delta (t-tests on the left, differences on the right):


and beta:

But as you can see, gamma still shows differences, and so I'm not sure which is the most reliable result. I'm leaning towards the difference result, since this doesn't seem to be affected as much by my low n, and because the difference results matched the ANOVA I ran in an external stats program:

Thanks again

Luli

The t-statistic and the difference are different measures. It is normal to observe differences.