Dear experts,
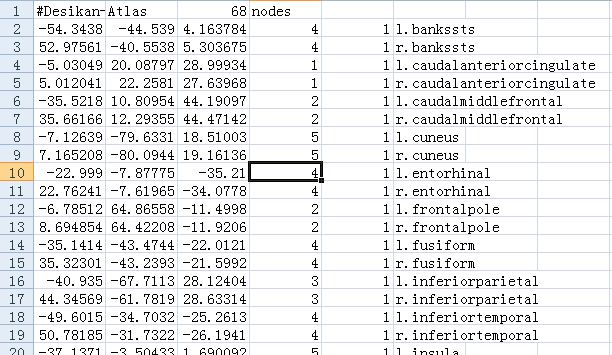
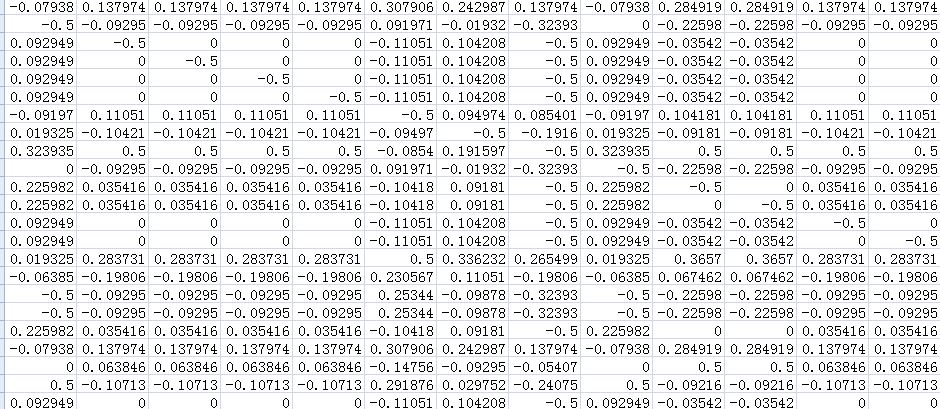
Recently, I used brainstorm to create whole brain connectivity matrices by phase transfer entropy in grand average EEG data of both experimental and control groups.I defined 68 scouts/nodes(Fig.1), so I got a 68*68 matrix/edges(Fig.2). Then I wanted to do statistical analysis(e.g., t test,ANOVA) to find which regions have significant stronger connectivity in experimental group than control group.But I do not know how to do that in brainstorm?
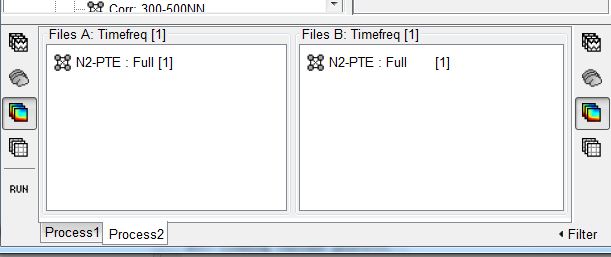
I tried to put two files(from experimental and control group,respectively) in Process2,but it could not work(Fig.3).Could you tell me how to do statistical analysis in the described circumstances?
Many thanks!