Tutorial 18: Colormaps
Authors: Francois Tadel, Elizabeth Bock, Sylvain Baillet
When displaying signals on the sensor array or on the cortex surface, we need to convert the amplitude of the signal into a color. The way the values are mapped to colors has a lot of influence over the visual interpretation of the figures. The selection of the appropriate colormap is an important step of the data exploration.
Colormap menus
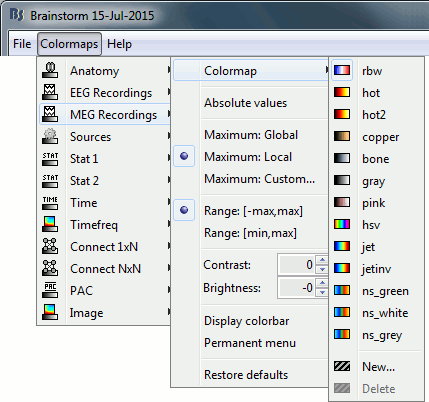
Brainstorm keeps track of many user-defined colormaps: anatomy, EEG, MEG, sources, stat, time, time-frequency, etc. You can go to the Colormaps menu in the main window to see this list.
Usually, you will use only popup menus from specific figures to edit the colormaps.
Open a topography view for the standard average (right-click > MEG > 2D Sensor cap).
Right-click on the figure, you will only see the menu "Colormap: MEG recordings".
- If you modify a colormap, the changes will be applied to all the figures, saved in your user preferences and available the next time you start Brainstorm.
Set the color list
A colormap is a list of colors that are indexed and then mapped to values. It is represented by a [Nx3] matrix, where N is the number of colors available in it. Each color is coded with three values corresponding its relative levels of red, green and blue. In Matlab, the colors are coded between 0 and 1. To get an example, type "jet" in the Matlab command window, you will get the default values for the "jet" colormap.
We offer two ways of creating this list of colors in Brainstorm: you can use standard color lists (modulated in contrast and brightness) or define your own list of colors. The colormap menus let you chose which standard colormap to use and how to regulate it.
Colormap name: The standard colormaps are referred to with names (bone, grey, jet, rwb, etc). Just pick a different color set in the menu to update all the figures with similar data types.

Brightness: Moves the center of the colormap up and down. Example values: -80, 0, +80.

Contrast: Saturates/desaturates the colors. Example values: -80, 0, +80.

The terms "brightness" and "contrast" may not be adapted for colormaps such as rbw, jet or hsv. It makes more sense for colormaps with only one tint that varies in intensity, such as the grey colormap. We use them here for lack for a better word.
You can modify those values by clicking directly on the color bar. Hold the mouse button, then:
Move up/down to change the brightness ,
Move left/right to change the contrast.
Custom color list
To edit your own list of colors, use the menu "New..." at the end of the standard colormaps.
Open a 2D sensor cap view for the MEG sensors of any average file.
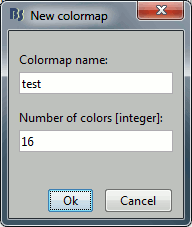
Right-click on the figure Colormap: MEG recordings > Colormap > New.Enter the name of the new colormap and the number of colors it will contain.
Enter a small number to better get the feeling of how it works.
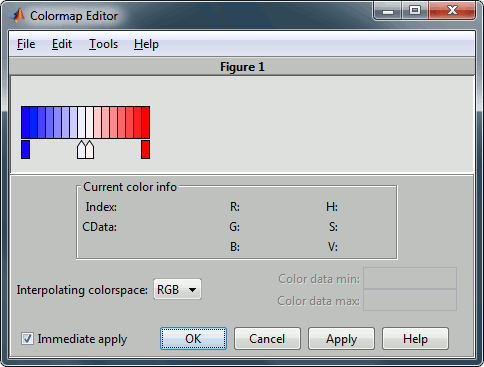
Each color in this colormap is represented with a little square. The arrows in the the second row can be selected and deleted (delete key) or edited (double-click). They represent the key colors between which Matlab will interpolate the other colors. Click anywhere on the second row to add more control colors.
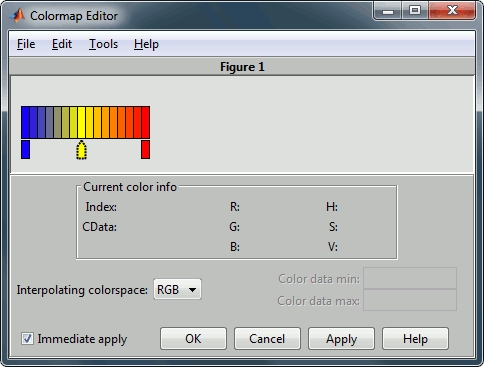
Once you are satifsied with your new colormap, click on [Ok].
It will update the figure. A new menu is now available in the list of available colormaps.
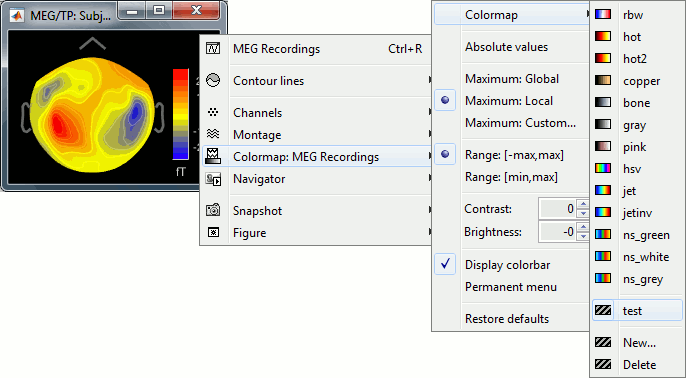
- To delete the custom colormap currently selected, select the menu "Delete".
Set the color mapping
How the values are matched with the colors.
Absolute values: Display the absolute values of the recordings, instead of the original values.
This is the default for Anatomy, Sources and Stat colormaps, but it is not very useful for recordings: for EEG and MEG, the sign of the values is very important.
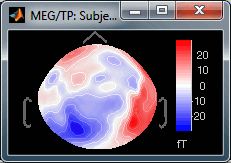
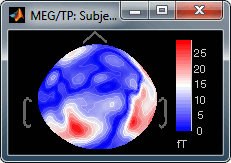
Fig.1: Relative values; Fig.2: Absolute values
Maximum: How is the maximum of the colorbar estimated, for the color correspondence.
Global: The bounds of the colormap are set to the maximum value across the whole time window. Eg. if you use the rbw colormap and the min and max values are [-100ft, +100ft], the colors will be mapped in the following way: -100ft is blue, +100ft is red, 0ft is white. The display is identical for each time sample. If you select this option at t=-49ms, the 2D topography figure will turn almost white because the values are low before the stimulus.
Local: It uses the local min and max values at the current time frame AND for each figure, instead of the global min and max. Eg. at t=-49ms, the extrema values are roughly [-25ft, +25ft]. So the colors will be mapped in order to have: -25ft = blue, and +25ft = red.
Custom: You can set manually the minimum/maximum bounds of the colorbar. It does not have to be symmetrical around zero. If you set the values to [-100, 200] ft, the white colors would correspond to values ~50ft, hence values around 0ft would be displayed in blue.
You can usually keep this option to Local when looking at recordings, it makes things nicer. But keep in mind that it is not because you see flashy colors that you have strong effects. It's always a matter of colormap configuration.
- Remember that when you change this option, it is saved in your user preferences. If you close Brainstorm and start it again, the colormap configuration stays the same.
Range: Use symmetrical or non-symmetrical colormaps.
[-max, max]: Symmetrical colorbar around the absolute value of the maximum. Eg. at t=47ms, the range is [-80ft, +100ft], and the colorbar used is [-100ft, +100ft], white is zero.
[min, max]: Uses the real min and max. Eg. at t=47ms, the colorbar used is [-80ft, +100ft], white is NOT zero.
- This option is ignored when the option "Maximum: Custom" is selected.
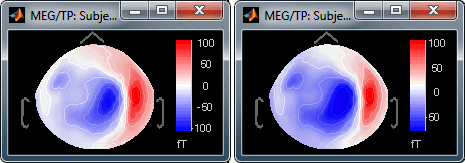
Fig.1: [-max,max]; Fig.2: [min,max]
Display colorbar: Just in case you want to hide the color bar...
Permanent menu: Open a window that displays this colormap sub-menu. Might be useful when you do a lot of colormap adjustments.
Restore defaults: Click on it now so all your experiments will be discarded.
You can also reset the colormap by double-clicking on the color bar.
