last edit: Apr. 3, 2021 by Yaqi
Loading Connectivity Graphs
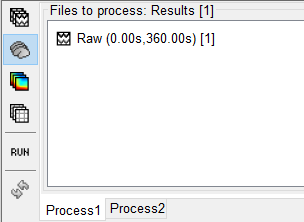
1. Drag the selected raw file into the process block. Ensure the "Process Sources" is selected on the left-hand side.

2. In the pipeline editor select "Connectivity", and choose the type of connectivity you would like to load. In this tutorial, we will begin with a Correlation N x N graph.
3. Once loaded, you should see the graph being listed under the raw file. Right-click on the graph and select "".