Hi,
I have couple of problems that i am facing
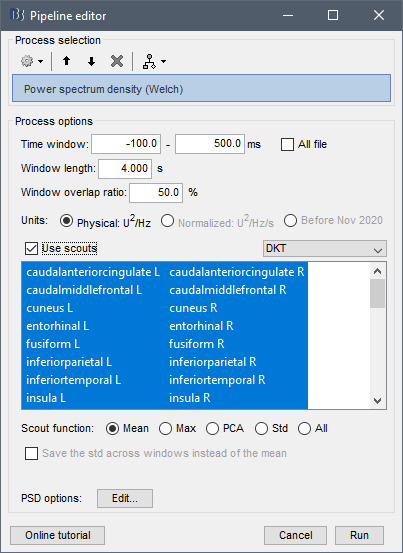
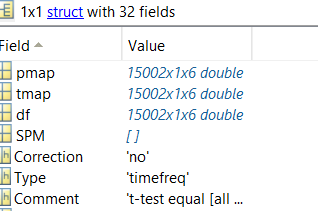
- After we calculate source statistics for PSD or Relative power, how do we extract p-values for each ROI ( i have used Desikan-Killiany), when i do import we get 1500216 matrix. but we would want for 68 areas. How do we do that?
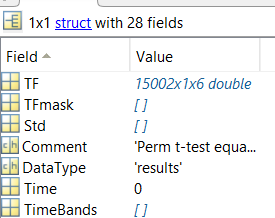
Same happens with permutation test as well?
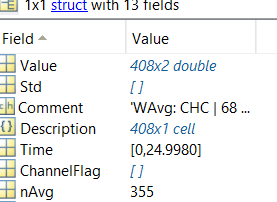
- If i calculate PSD or RP values at source space then average them later to extract scout series , as table format we get 68*1 table but the same when exported to MATLAb we get 408 x 2, why is that? how do we get 68 x 1 in MATLAB?
Any matrix function similar to bst_memory('GetConnectMatrix',~) for PSD values restructuring in matlab?