1*N coherence computation and tests

Hi,
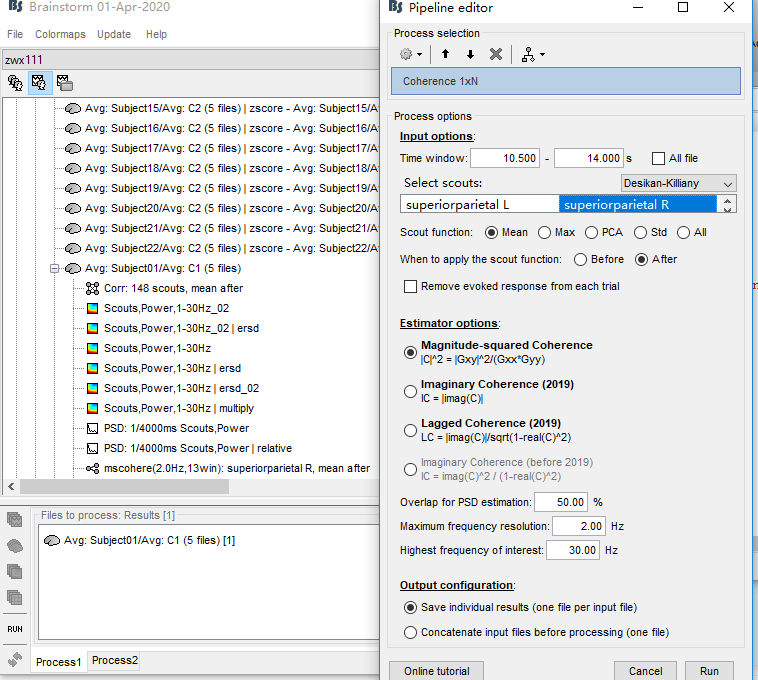
I tried conduct 1xN coherence based averaged files for each subject under each condition.See the first picture


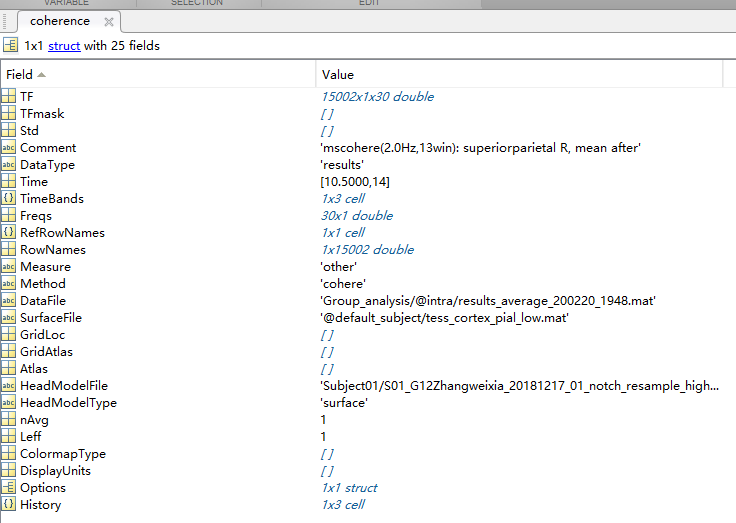
Then, I got the coherence data for each subject under each condition. See the second picture for the data strcuture.

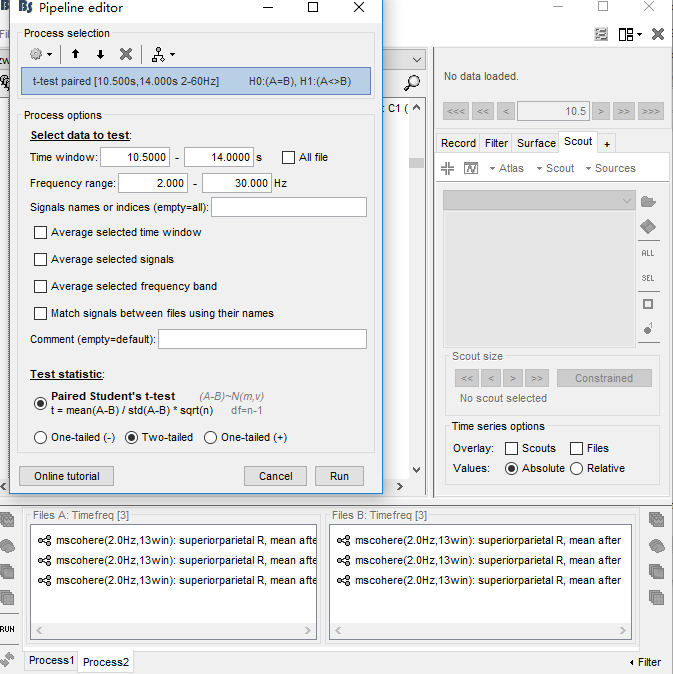
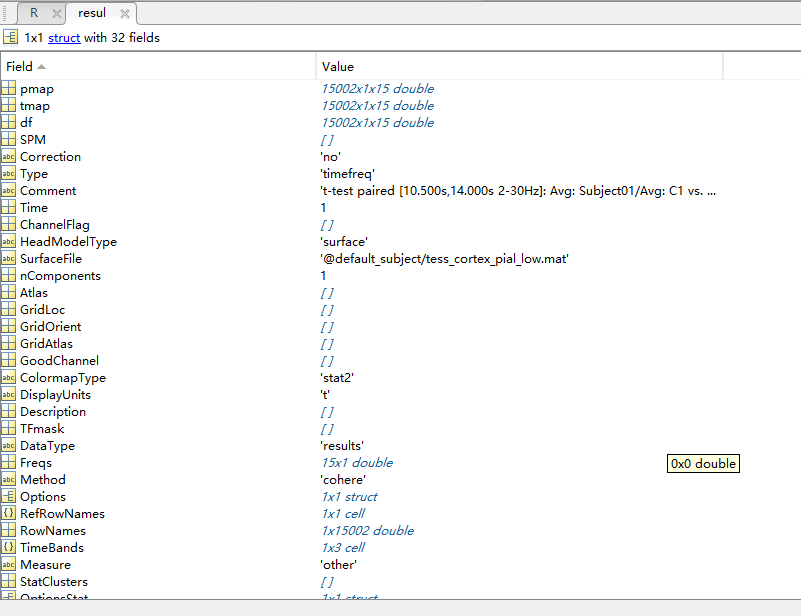
Finally, I conuct t test between two conditions to see if there were any difference. I drag the coherence data into process2.See the third and forth pictures for my process and results syructure.


however, there are some questions I cannot understand yet:
1, should I drag averaged source data or baseline corrected averaged source data before conducting coherence (I chose the former one in my analysis). After the computation of coherence for each subject under each condition, is it necessart to normalize the data? If, it is, which method will be recommended?
2. my data was 14s long, I'm intrest in 10.5-14s. As for the time window selection, can I select my intrested period or must I input all my data?
3, after the computation of coherence, the data structure was 15002130. I don't know what does 15002 mean.
4, I want to investigated if there is any coherence (the relationship between my scout and other areas on any frequency band activity) difference betweeen two conditions. Howver, I cannot see any information about brain area and band activity from pmap.
5. If it is possible to compute coherence within intrested band, like 4-8 Hz?

I tried conduct 1xN coherence based averaged files for each subject under each condition

You should not compute the coherence (or any other connectivity measure) on averaged recordings, but on single trials or concatenated single trials. Averaging destroys the components of the signals at higher frequencies, which you need for connectivity or time-frequency analysis.

1, should I drag averaged source data or baseline corrected averaged source data before conducting coherence (I chose the former one in my analysis)

You should obtain very similar results no matter what normalization you use for the source maps. For frequency/connectivity analysis you can use non-normalized current density maps. Only on recordings that were not averaged.

After the computation of coherence for each subject under each condition, is it necessart to normalize the data?

Coherence is a normalized measure (between 0 and 1), I don't think you need to normalize it across subjects. If you're not sure, ask the authors of methods publications you are using as references in your analysis.

  1. my data was 14s long, I'm intrest in 10.5-14s. As for the time window selection, can I select my intrested period or must I input all my data?

This is an experimental design question related with the hypotheses of your study, not a technical question. I don't think I can give any relevant advice on this question.

3, after the computation of coherence, the data structure was 15002x1x30. I don't know what does 15002 mean.

This is the number of sources. Get back to the source estimation tutorial, especially the sections that explain the structure of the files. The functional connectivity tutorial also includes pointers to forum discussions about the storage of connectivity matrices.
https://neuroimage.usc.edu/brainstorm/Tutorials/SourceEstimation
https://neuroimage.usc.edu/brainstorm/Tutorials/Connectivity#Additional_documentation

Howver, I cannot see any information about brain area and band activity from pmap.

I'm not sure what this means. Depending on the options you select in the coherence computation, you would have different types of data in output, and this defines what kind of displays you have access to. You should always have access to the "spectrum" view at least. Right-click on the files and explore what is available.
The frequency slider should be available in the Brainstorm window as well, get back to the time-frequency tutorial for instructions on how to explore the frequency dimension of your data.

  1. If it is possible to compute coherence within intrested band, like 4-8 Hz?

You can average the coherence values in a specific frequency band after computing it. There is a process dedicated to this.
Or use Amplitude Envelope Correlation instead.

2 Likes

Thanks for your reply, you really helped a lot !