I have a problem regarding the topographical maps of my data, which look abnormal while they were normal before source localization. More precisely:
I have EEG data from 45 participants, I have done the normal pre-processing steps for all the participants and I am now at the source localization level of analysis.
I visualized ERPs before source localization and the topographies looked normal.
For source localization, I used individual MRI, that were segmented + MNI normalized (maff8). I generated BEM meshes. Then , since we had only some default coordinate for the electrodes, I used refine registration and electrode projection on surface to align as well as possible the electrodes to the subject’s anatomy. Then I computed OpenMEEG BEM head model. From there, since we have several runs and sessions per subject, but all with the same anatomy / electrode location (and alignment with anatomy) / head model, I used 1) import channel from BST menu to copy the channel file (whose location had been adjusted to the individual MRI) into all subject subfolders; 2) copy head model in order to copy the computed OpenMEEG BEM model into all subject subfolders. These 2 operations were scripted by an MEG-EEG engineer, to avoid any human error in the copying of those files. Finally, I computed the noise covariance matrix based on the baseline between -200 to 0 ms of all the trials for the subject, and computed sources (with the options: current density maps; unconstrained).
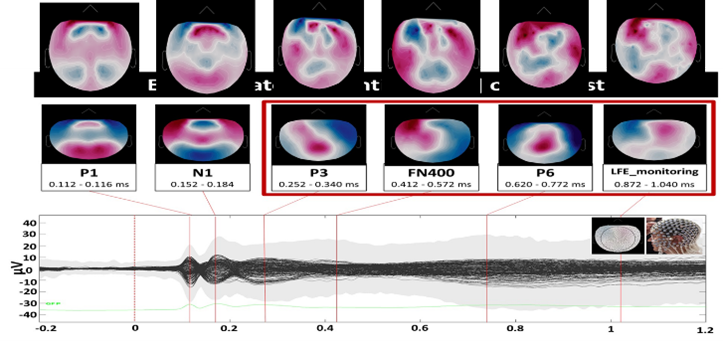
My problem is that after all this, I came back to my ERP scalp topographies and they look totally abnormal: see below. The top row are the abnormal topo maps. The bottom row is the original topo maps (of the ERPs, before all the process done for source localisation).
I have checked that the electrode positions are correct (when I display the electrodes on the topo, they are in the right location; moreover, when I display sensors on head or check their location with respect MRI, they are well located, in line with the alignment procedure I did).
Can you help me detecting what might be the reason for these abnormal topographical maps?
Make sure there is no filter applied as you visualize the topo maps , or toggle back and forth with and without the visualization filter. Also, it looks like the topos are inverted somehow (positive blobs matches the shape and location of the negative blobs): maybe the new version has been re-referenced with respect to the average potential. Finally, the shape of the topo maps are different: the bottom row's seem compressed vertically, or is just a different screen capture?
Thank you for your reply Sylvain.
We have checked that and there is no filter applied and indeed the difference in the shape of the topo maps is just because it is a different screen capture.
Unfortunately, we still did not find a solution for the problem and therefore I have another question.
Do you know if the average and ssp information contained in the channel.mat file is used after they have been applied? (i.e. are they applied on the fly whenever data are visualized or are the data written with projectors applied once and for all)
Those parameters are stored in the channel file, and they are not applied until you import the recording to the best database.
If you display your data from the "link to the raw file", those parameters are just used for the display. When you import the recording into the brainstorm database, then these options are applied once, and the data is saved to the brainstorm database.
Thank you for your previous answer.
However, we still facing the same problem and struggling to understand what is going on.
Therefore, we have another question:
When I use the import function to import same channel file (channel.mat) within a directory of epoch trial-by-trial data, are the active projectors contained in the channel file applied to the trial-by-trial data (already present) contained in the destination directory?
Additionally, we tried to investigate our problem further we found:
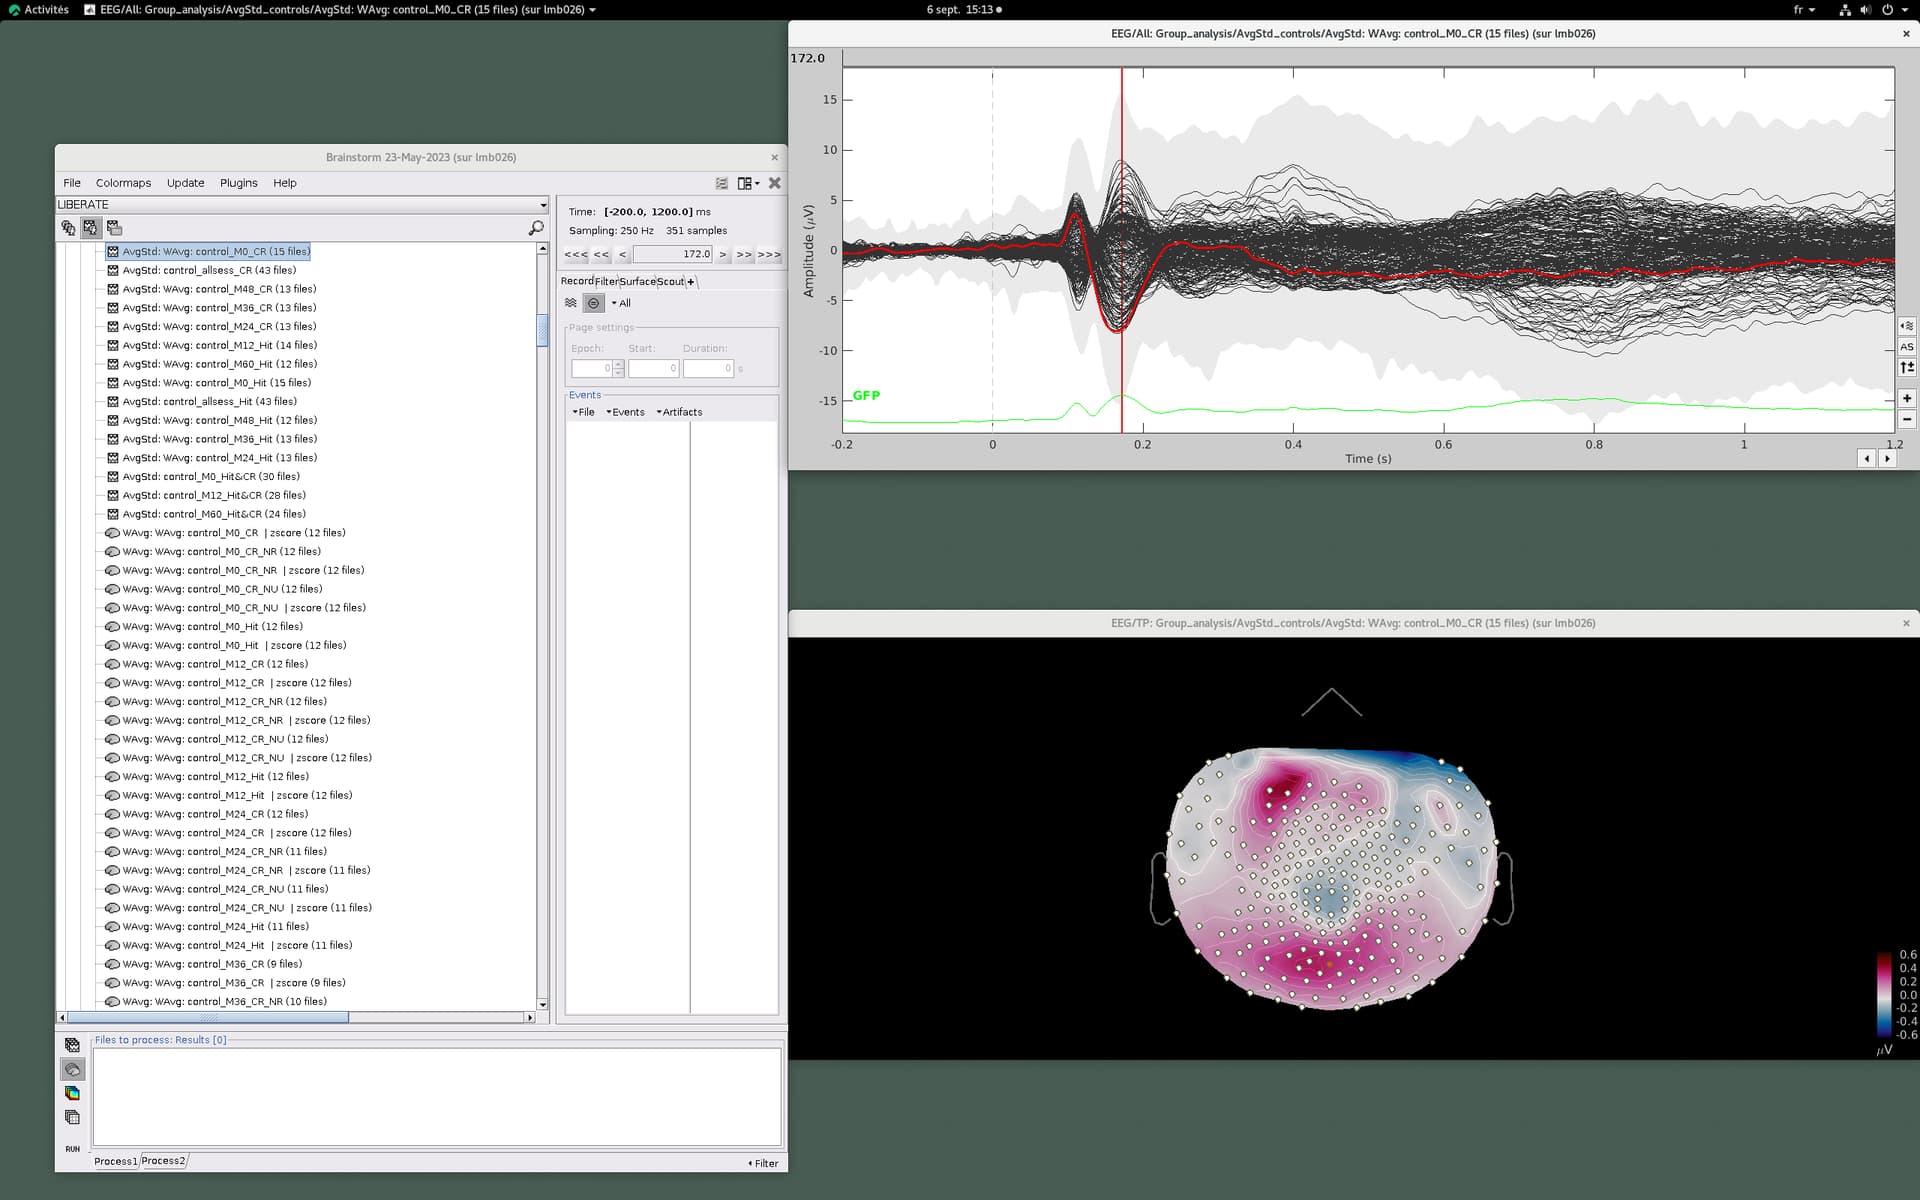
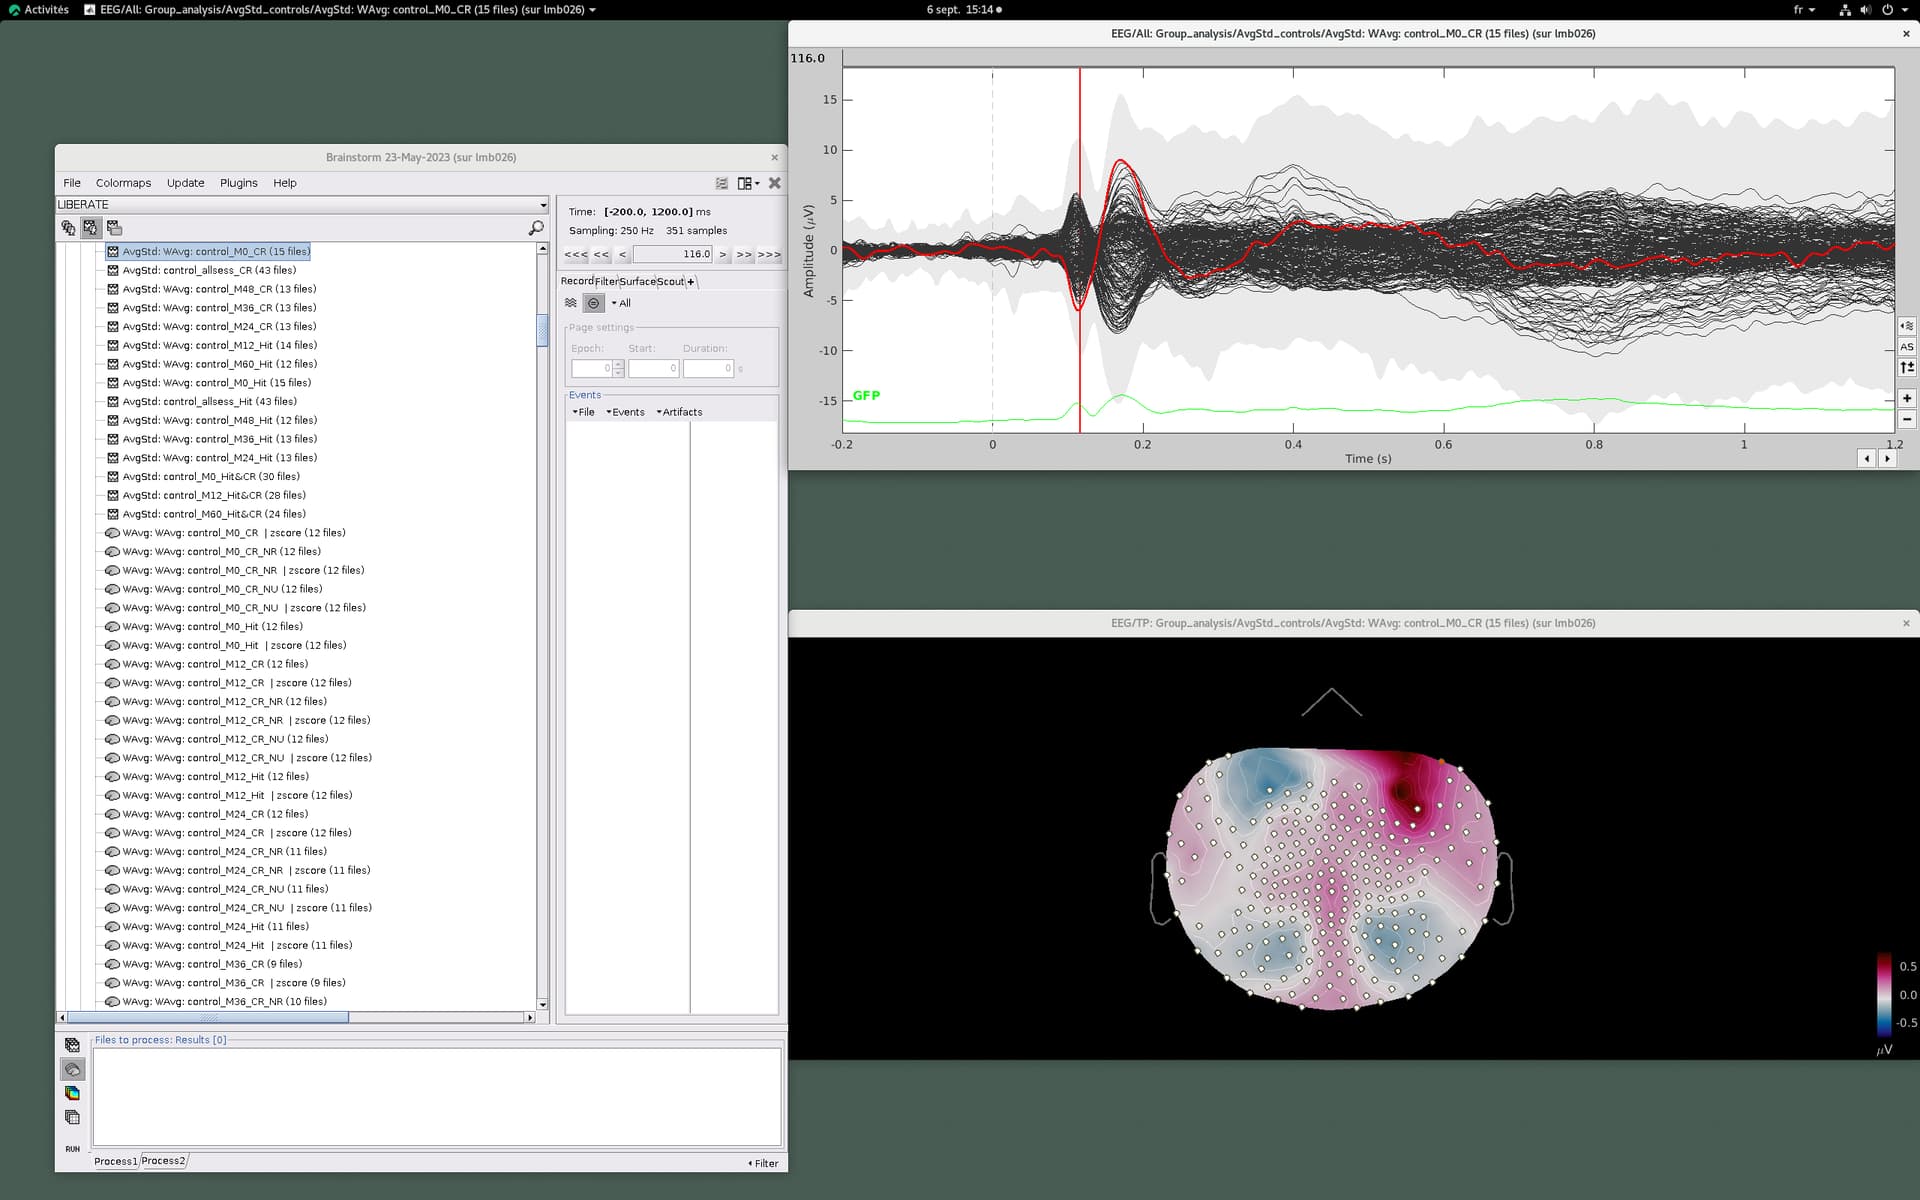
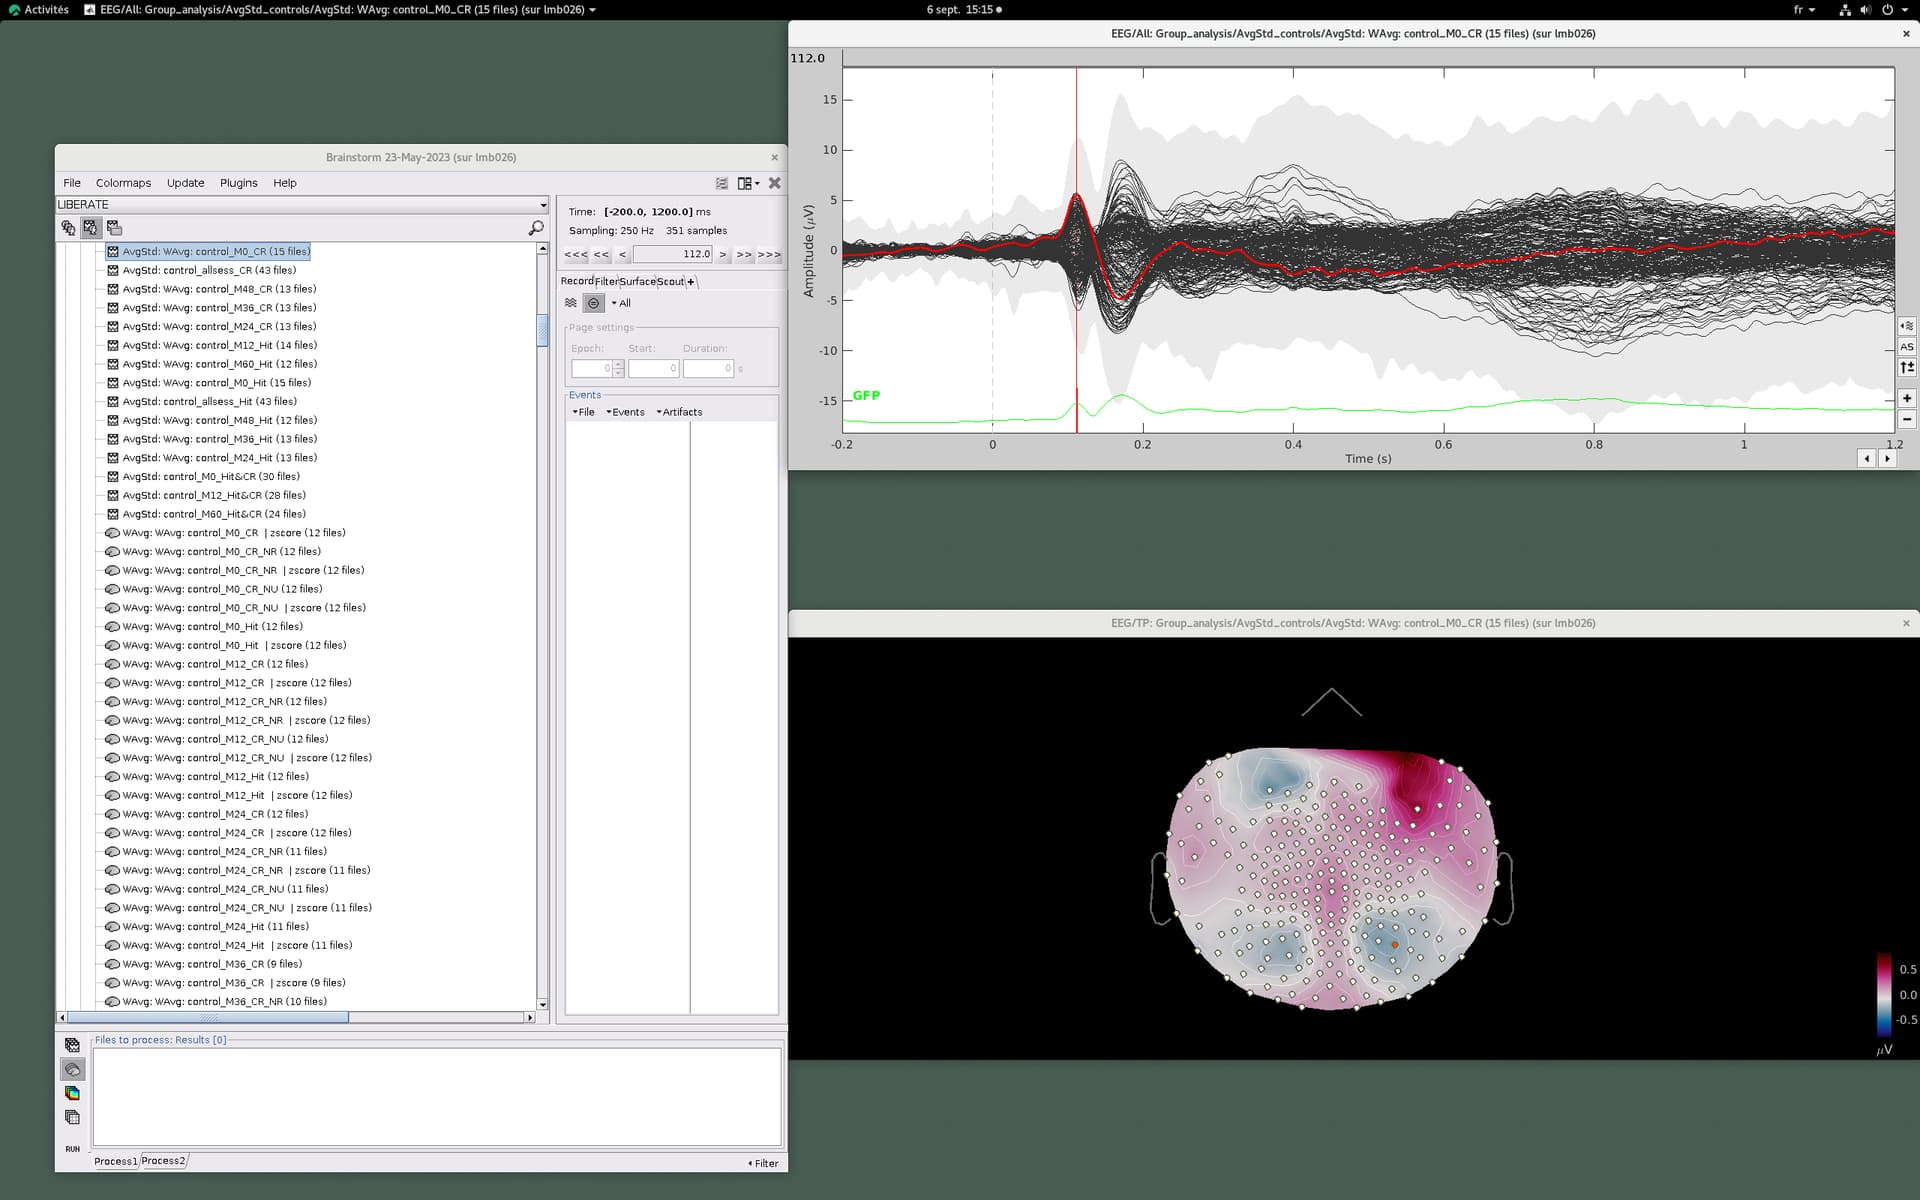
There is an inconsistency between the topo maps and the time-courses of the data. See attached.
Selected time-courses = in red, time instant = marked in the vertical red line, channel of selected time-course = in red on topo map.
We see negative activity on the time-course and positive activity on the topo map.
For another channel/ time-course, we see the inverse positive activity on the time-course and negative activity on the topo map.
How is this possible??
NOTE: we used default common electrode loading to visualize grand average data and we checked electrode location (default position was ok)
Have you tried checking the montage in the topography plot?
For the values in your topoplots, it seem the Scalp current density (SCD) is selected.
Change it to All channels if that is the case:
Right click on the colorbar > Montage > All channels
Alternatively with the topoplot figure selected, change the montage (in the Record tab) to All
Thank you so much!
It was indeed just the montage and now we back to the normal topos.
We must have changed it without realizing (from all channels to SCD).