Hi everyone,
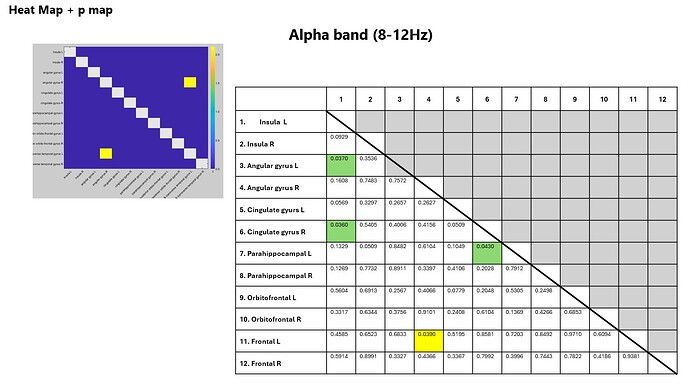
I want to ask about the pmap value on the heat map from the permutation t-test results. after I did the test, significant results (different colors) were displayed on the heat map, but after I checked the pmap value one by one, there were several columns that had significant pmap values as well, but the heat map did not read significantly (with a change in color). what is this? does anyone have knowledge or experience related to this, thank you for your help.
The left side is the result of the heatmap. The right side is after I check the pmap value one by one for each column. (yellow, significant by heatmap; green, pmap <0.05 but not read as significant on heatmap)
Best regards,
Budi
