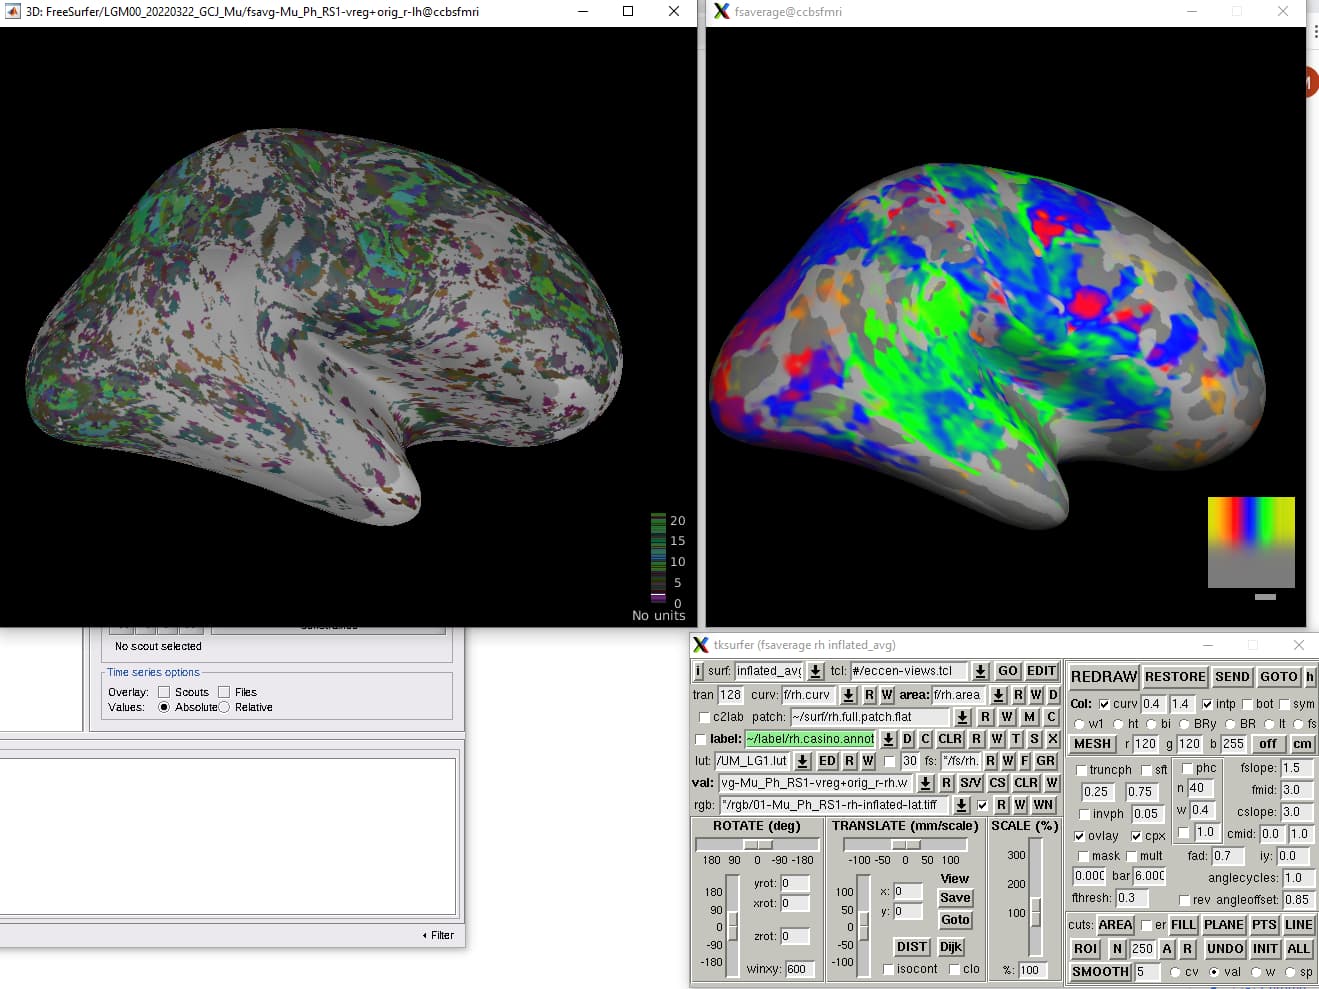
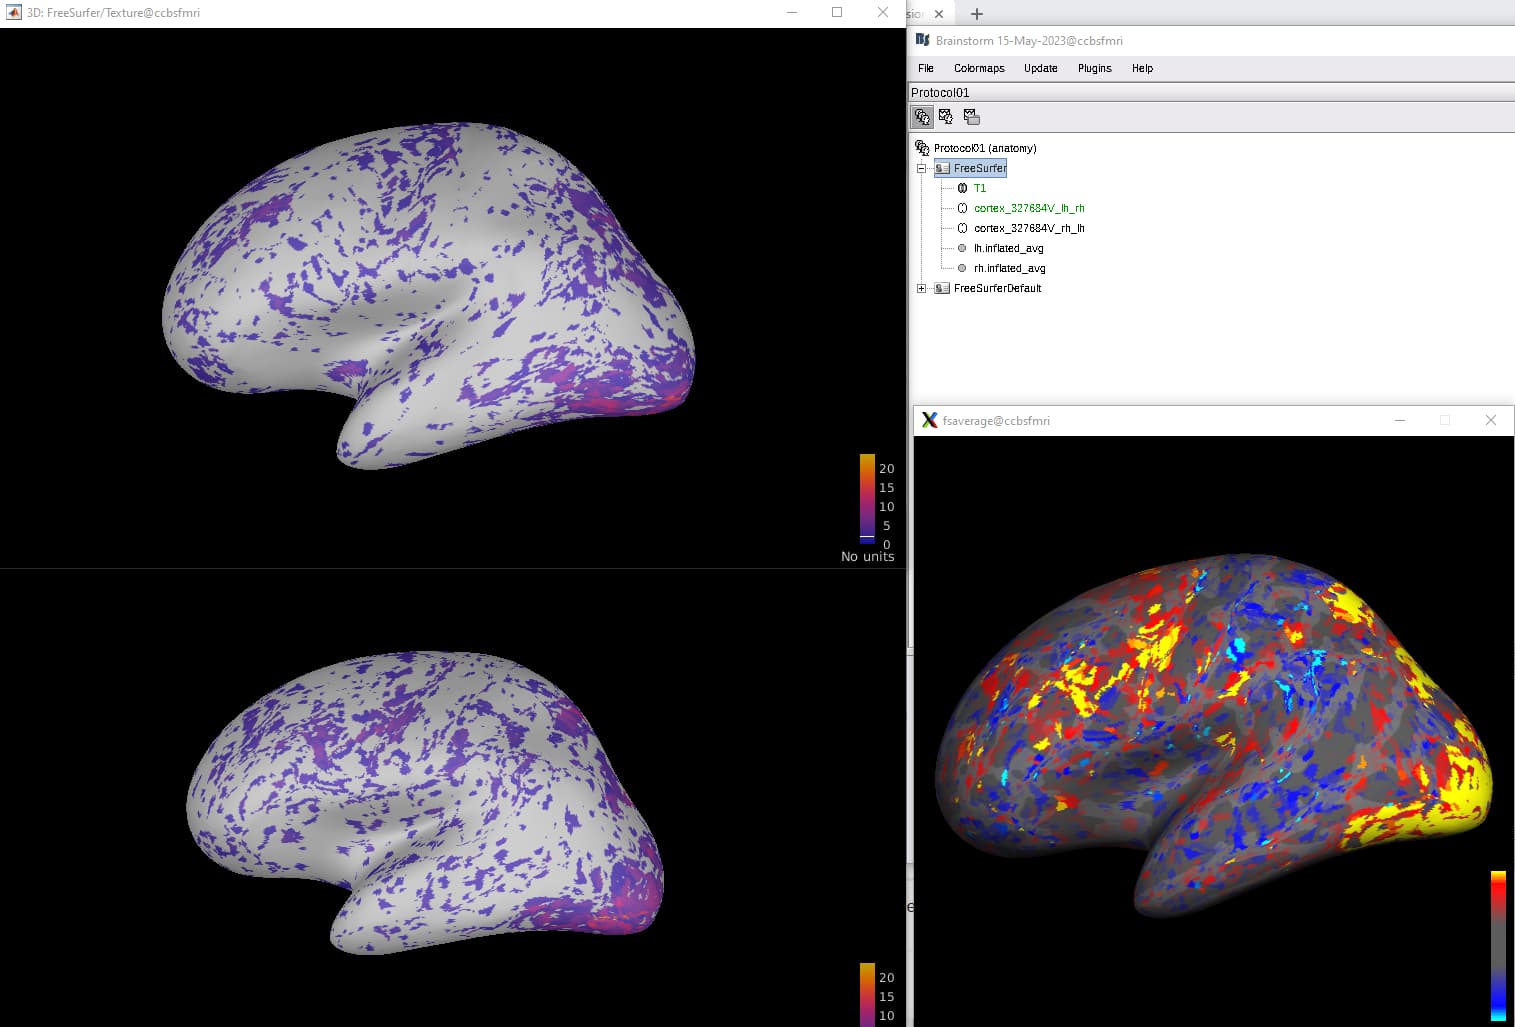
I am trying to visualize the vertices in the Brainstorm as same as in the freesurfer, but after I imported my lut file (UM_LG1.lut) as "colormap"? The result is not the same (
). The left side is the image in Brainstorm, and the right side is the image in the freesurfer, what other setting do I need to modify so that It can be more similar?
On the other hand, It seems like the activating areas in these images are different.
Technically, it should be the same or at least very similar, but It seems very different. If anyone has any idea how to fix it, please tell me, it will be great help
The colormap (UM_LG1.lut) seems to be only defined for (angle) values between 0 and 1 (with 0.1 steps). However the wfiles contain data from around -20 to 12. Also, I'm not sure what is that is shown in the right figure.
What is that you expect?
Ans: I want to see what areas are more active in relative ampitude.
Are the w-files phase values?
Ans: The value in w files are not involving time, so it is not phase values.
Are those values in deg, rad, other?
Ans: I think those values (in weight files) just represent the relative ampitude? It is not in degree or rad.
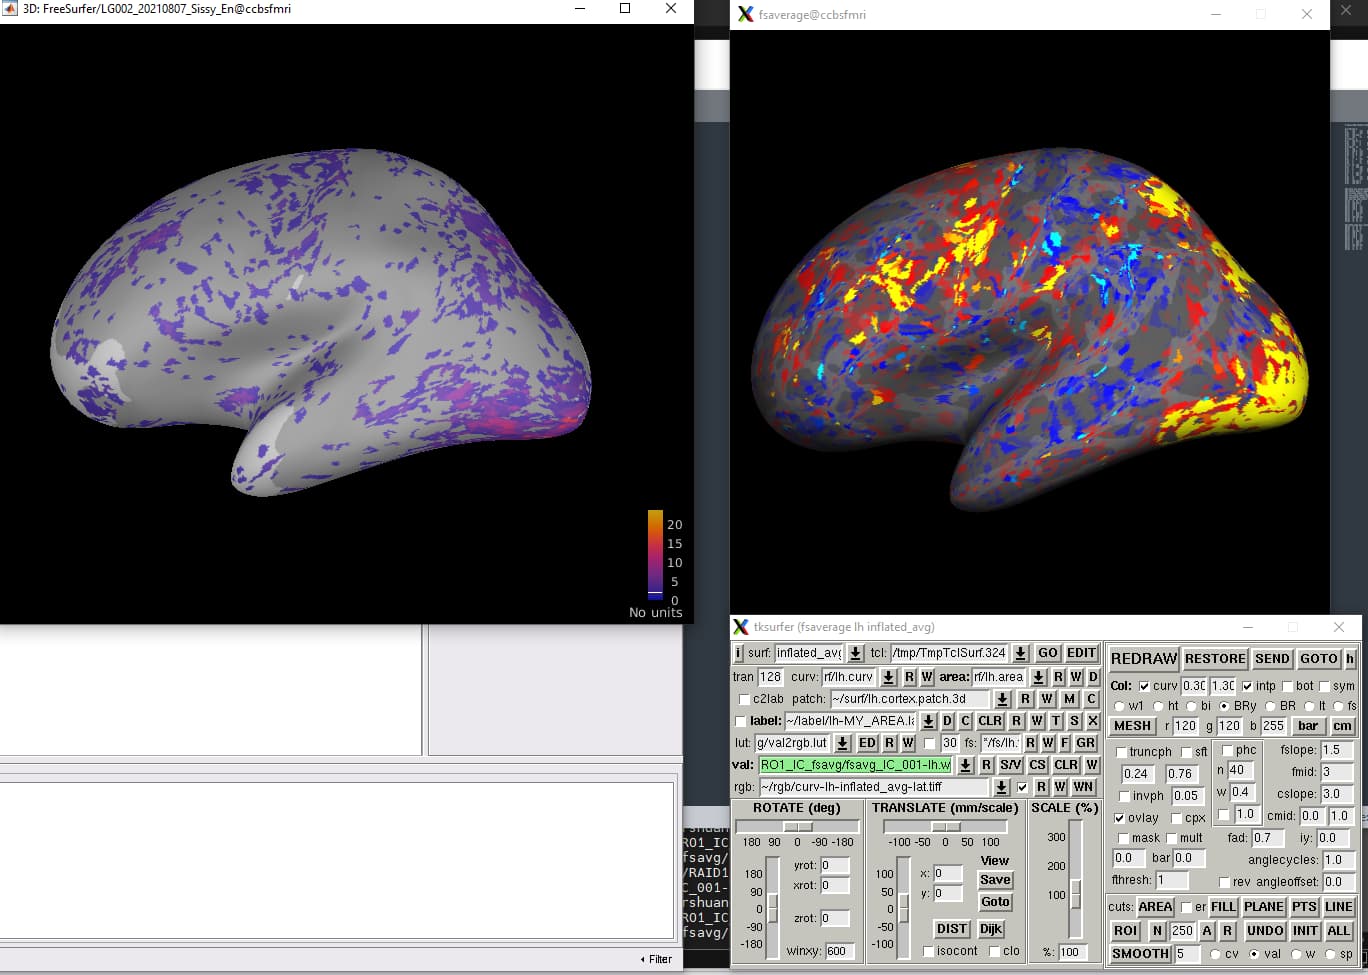
For the last quesitons, I may make a mistake when comparing brainstorm's image and freesurfer's image, here is the updates of the images after I changed the setting in freesurfer
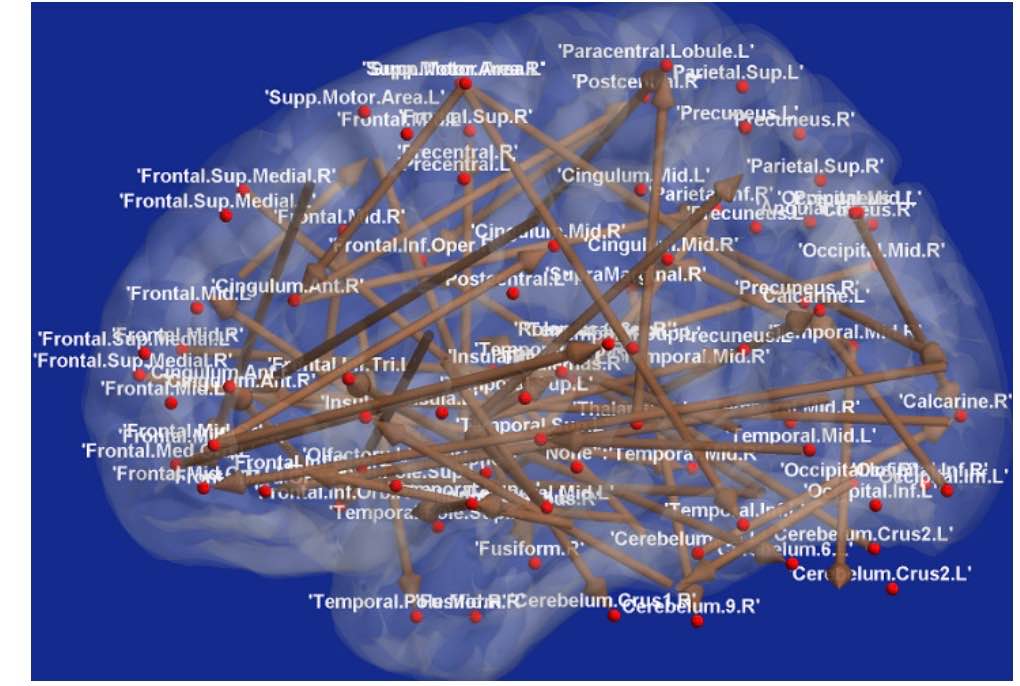
Additional questions, lets say I have a 100 weight files, and I have caluculated a pearson's correlation matrix of those files, and I want to draw a network of it. Can I do it in brainstorm? Like the picture below (assume the vertices in the image is given and all I want is to draw the lines between them based on the correlation value)
For the updated images, it is still wrong, and I think I know why. 'Brainstorm' makes wrong matching, it uses the rh weight file to match the lh vertices and uses the lh weight file to match the rh vertices, how to fix it?
I double-checked the correspondence between # of vertex and the weight files, and it seems ok. The lh and rh wfiles are loaded in this order, thus lh are the from 1 to ~163k vertices and rh from ~163k to ~327k.
These are the steps I'm doing:
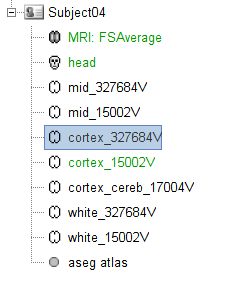
Create a new Subject: No Default anatomy, No Default channel
Right-click on Subject > Use template > FsAverage > FsAverage_2020
Right-click on cortex_327684V > Import texture: select a pair of lh and rh wfiles
On the Functional data view (), double-click on Subject > Texture > imported_texture
Hi, thanks for your reply, you are right, after I try the w files in the freesurfer's template cortex, the result is correct. Therefore I think the cortex is the reason why I get the wrong result. And I think I know what the problem is. The order of selecting the file when merging the surface is very important, if I choose the rh surface first the vertices' order will become wrong, even if the merged surface looks the same as choosing the lh surface first. You can see the difference in the image, the first result (select rh_inflated_avg first) is not the same as the second and third (select lh_inflated_avg first).
Indeed that is the thing it was happening. Importing w-files has a check to always merge first LH then RH. But this order is not reinforced in merging surfaces, as they do need to be hemisphere surfaces. We will add a check for hemisphere surfaces and sort them LH first then RH. Thank you for feedback