- What is that you expect?
Ans: I want to see what areas are more active in relative ampitude. - Are the w-files phase values?
Ans: The value in w files are not involving time, so it is not phase values. - Are those values in deg, rad, other?
Ans: I think those values (in weight files) just represent the relative ampitude? It is not in degree or rad.
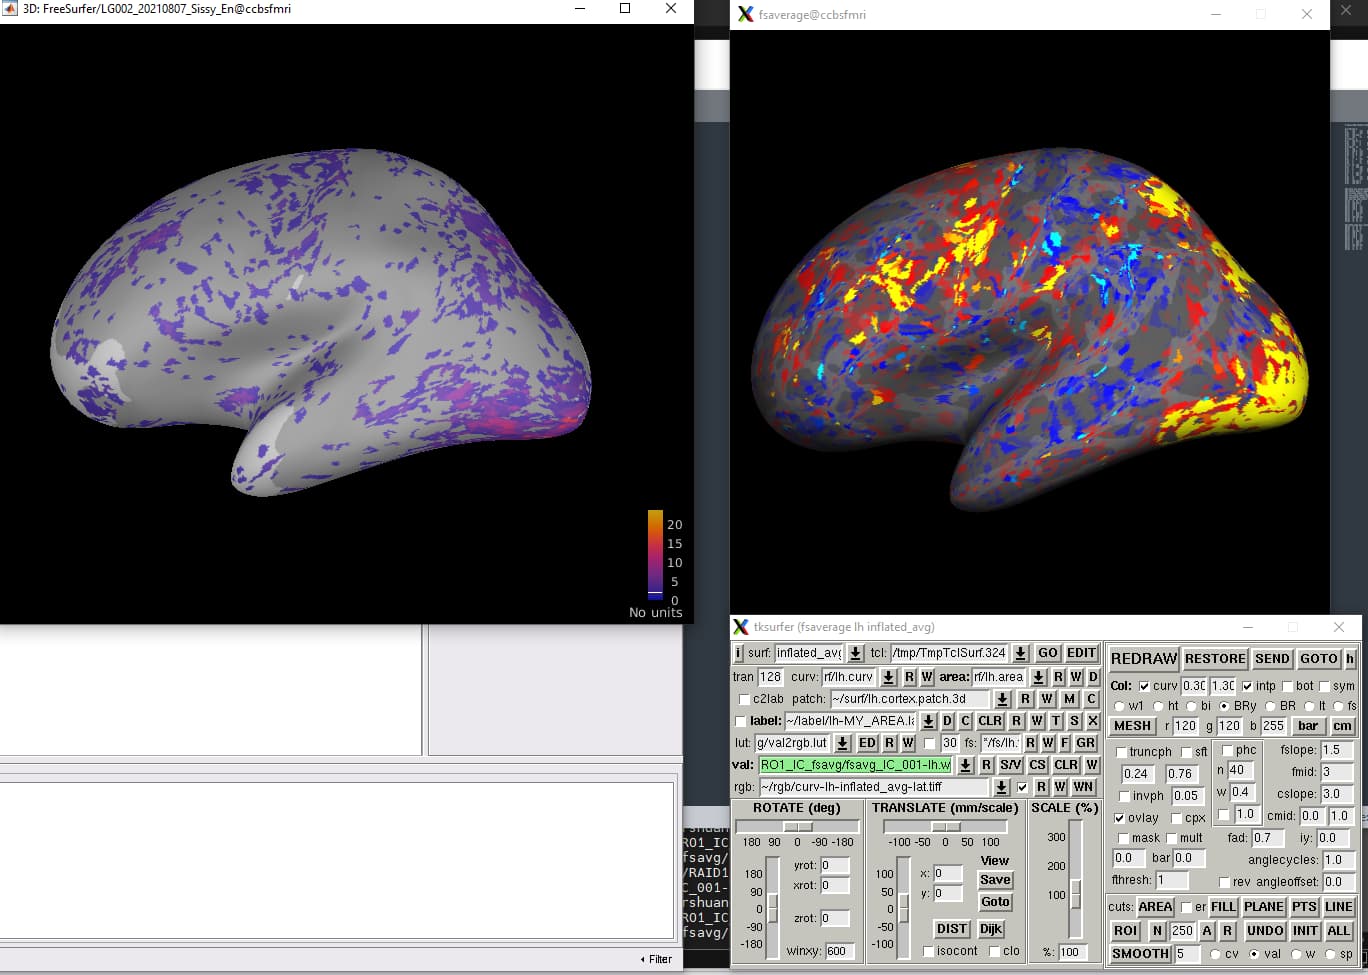
For the last quesitons, I may make a mistake when comparing brainstorm's image and freesurfer's image, here is the updates of the images after I changed the setting in freesurfer
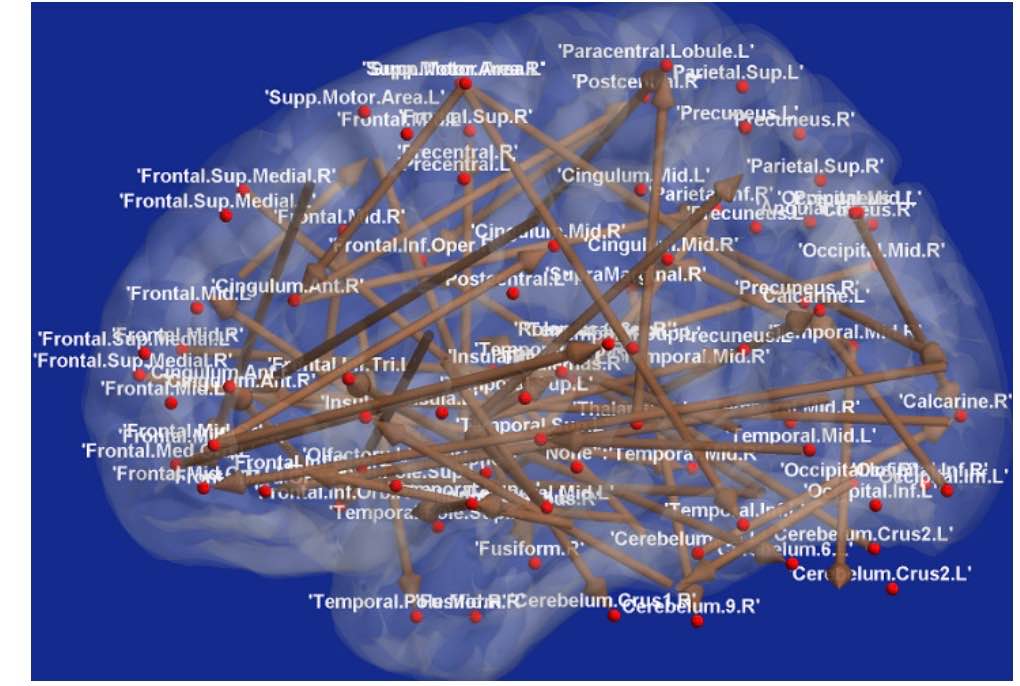
Additional questions, lets say I have a 100 weight files, and I have caluculated a pearson's correlation matrix of those files, and I want to draw a network of it. Can I do it in brainstorm? Like the picture below (assume the vertices in the image is given and all I want is to draw the lines between them based on the correlation value)