The first question:
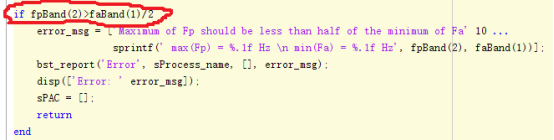
the default parameters of brainstorm are shown in the figure below, so whether it should be changed during the initial confirmation, otherwise Fp=[2-12 Hz] ,Fa=[15-250 Hz]. It will report an error.
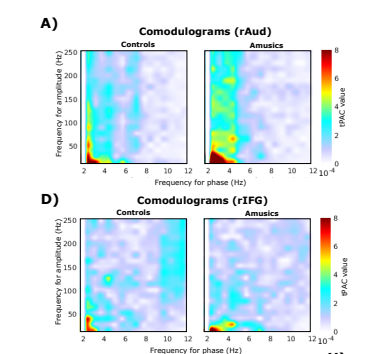
So how did you get the following picture?
the second question:
"The tPAC values obtained from surrogate data were distributed normatively (Shapiro–Wilk test, p>0.8)", does this sentence mean that P > 0.8 appears at every time point in every epoch? How to deal with the details of this process?
for example, if I have 100 trails, choose 5 time points for each trail, and generate 500 substitutions at each time point, then do I splice all these samples together to test the normal distribution? I tried 500 substitution tests at each time point in each trail ,
and this will show that most of them do not conform to the normal distribution,It is only approximately normal distribution. So should I do a normal test every 500 sample separately, or do a normal test by splicing all the data?
the third question:
There are some source points in each ROI. When calculating the tPAC in the ROI area, I first perform surrogate analysis on each source point to calculate the Z-Score, and then average the tPAC of all source points to get the average of the ROI area.
Although the questions you asked are not entirely aligned with your post above, I am pasting here our recent communication together by email, for the record.
The frequency band of interest in this paper is [2-12 Hz] in the low frequency band and [15-250 Hz] in the high frequency band, but the tPAC algorithm suggests that the maximum value of the low frequency band should be half of the minimum value of the high frequency band. This doesn't agree with your paper. How do you explain it?
That’s right, however, this can be adjudicated later after fP and fA are identified. Note that the minimum fP is 2Hz here, hence the minimum fA could be as low as 4Hz. However, if the data show fP as 12H, then any finding with fA below 24Hz should be rejected or carefully discussed.
The sliding window should be twice the reciprocal of the minimum value of the low frequency band, so the minimum setting should be 1s, but is it reasonable to set it to 700ms in your article?
"The other parameter that should be defined by the user is the length of sliding time window. This window should be long enough to cover at least one full cycle of fPmin” (here 2 Hz, hence minimal window length should be 5000 ms.
The generation of substitution data in this paper will lead to many epoch when calculating PAC, and all 500 substitutions at some time points will be 0, which will lead to the calculation value of formula (1) in this paper as NAN, because the variance and standard deviation are 0. How do you solve this problem?
Sorry, I don't understand where you're getting at, despite the table you sent in your most recent email.
"The tPAC values obtained from surrogate data were distributed normatively (Shapiro–Wilk test, p>0.8)", does this sentence mean that P > 0.8 appears at every time point in every epoch? How did you get this detailed process? As I am doing research in the same field, I hope you can give me a clear answer. The reappearance of relevant conclusions makes me very confused.
The Shapiro–Wilk was conducted on the empirical distribution of all tPAC values derived from all time windows across all surrogate samples.
the third question:
There are some source points in each ROI. So what should I do when calculating the tPAC of ROI area?
Does it operate like this? When calculating the tPAC in the ROI area, I first perform surrogate analysis on each source point to calculate the Z-Score, and then average the tPAC of all source points to get the average of the ROI area.
Either extract a time series representative of those in the parcel (e.g., via PCA) and run tPAC+ surrogate on it, or run the tPAC + surrogate analysis on all sources in a parcel and extract summary statistics, if needed.