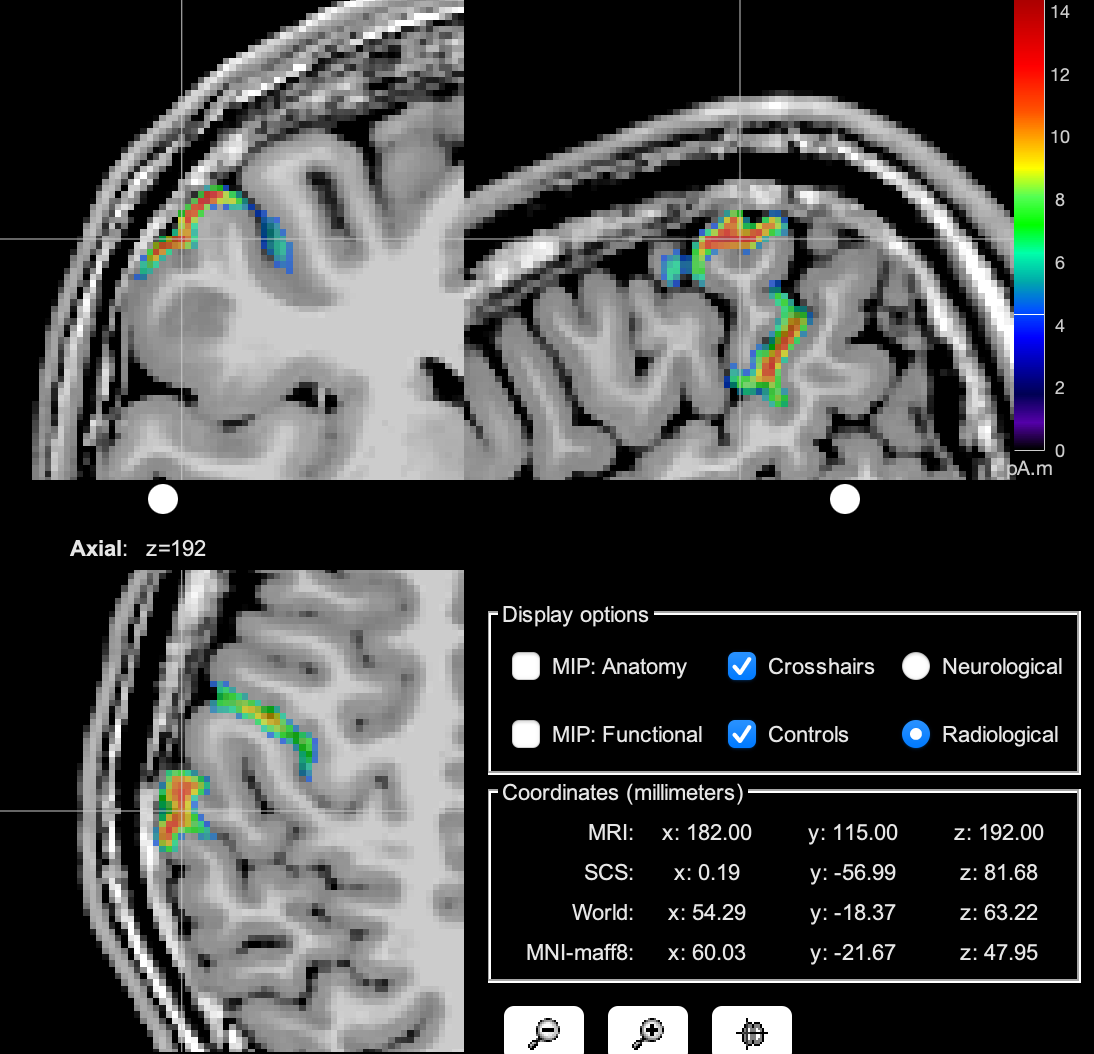
Activation map fixed when scrolling MRI slices

Since the latest update, cortical activation with MIP:functional on does not show the activation properly. The activation map seems to be fixed even though we are scrolling the MRI. Please see the attached screen capture to understand better what I mean here.

How to fixed this?

Thank you.

Hi @hmkhoo,

This is the expected behaviour when using MIP: functional (Maximum Intensity Projection), what it is obtained is the maximal intensity across the 3 dimensions (axial in your case). To see the activation on the current slices, uncheck MIP: functional (right-click on the Figure > MRI display).

Example: Right: checked MIP: functional ||| Left: unchecked MIP: functional

|||

Hi Raymundo,

Thank you for the explanation.

However, when I uncheck MIP:functional, the activation show up only on the surface.

Before the update, activation shown up as a cluster like what you have shown on the right of your example by clicking on the MIP:functional.

By unclicking MIP:functional, activation was shown only on the surface like the image above.

How to fix this?

Thank you.

Note the horizontal white line in the color bar:

image

This line indicates that the sources are thresholded by amplitude.
Set to 0% the Amplitude slider on the Surface tab

For more details, check this section on the Source estimation tutorial: