Hi there BST community,
I think this will be more of a "request" post rather than a general discussion post but I will categorise it as a general discussion in case anyone in the community has any ideas.
Right now I am trying to determine the peaks and troughs of auditory evoked potentials (AEPs); cortical auditory evoked potentials (CAEPS) and auditory brainstem responses (ABRs).
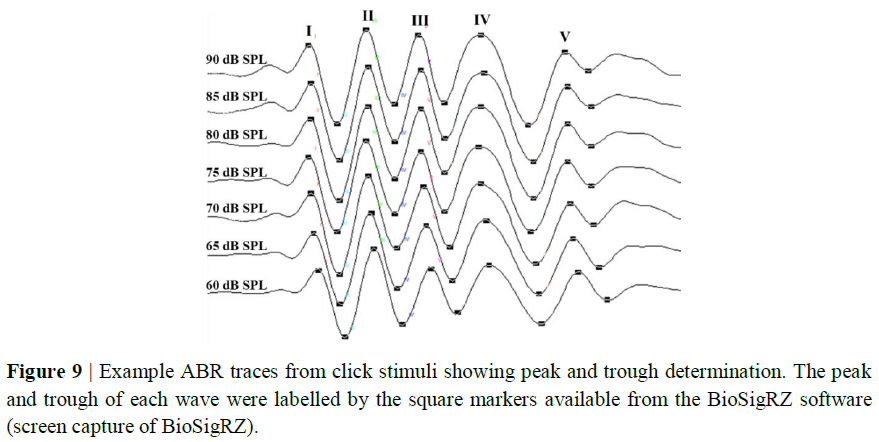
I used to use BioSigRZ software (a TDT software) to do this where I open up an ABR trace, double click on a particular location on the waveform to add a marker, and export the ABR trace with the markers in an Excel form from BioSigRZ. The exported Excel file will have the ABR trace in the time domain as well as the latency and voltage value of the markers so that calculations of amplitudes and latencies of the ABR waves can be easy.
The below diagram shows an example of that showing several ABR traces with markers on their peaks and troughs.
My question is, can something similar be done within Brainstorm and if not, is it possible to add this as a feature?
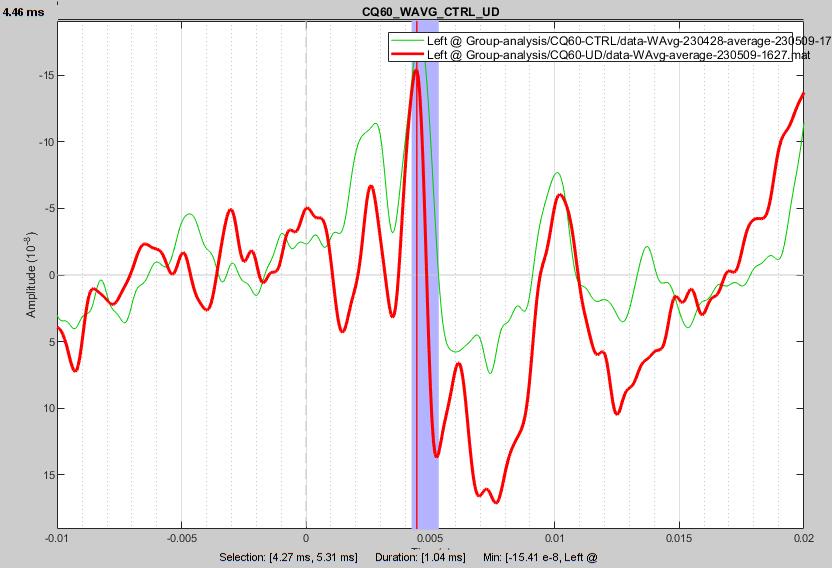
Right now I am selecting a portion of the ABR trace to include the peak and trough (seen below) and manually typing the values down in an Excel file which I deem inefficient.