Thanks again Francois. One more query, I have run the paired permutation test for the two conditions as suggested (both t-test, and Wilcoxon sign test) and the intensity thresholds that I am getting in the connectivity graphs are negative (screenshots attached).
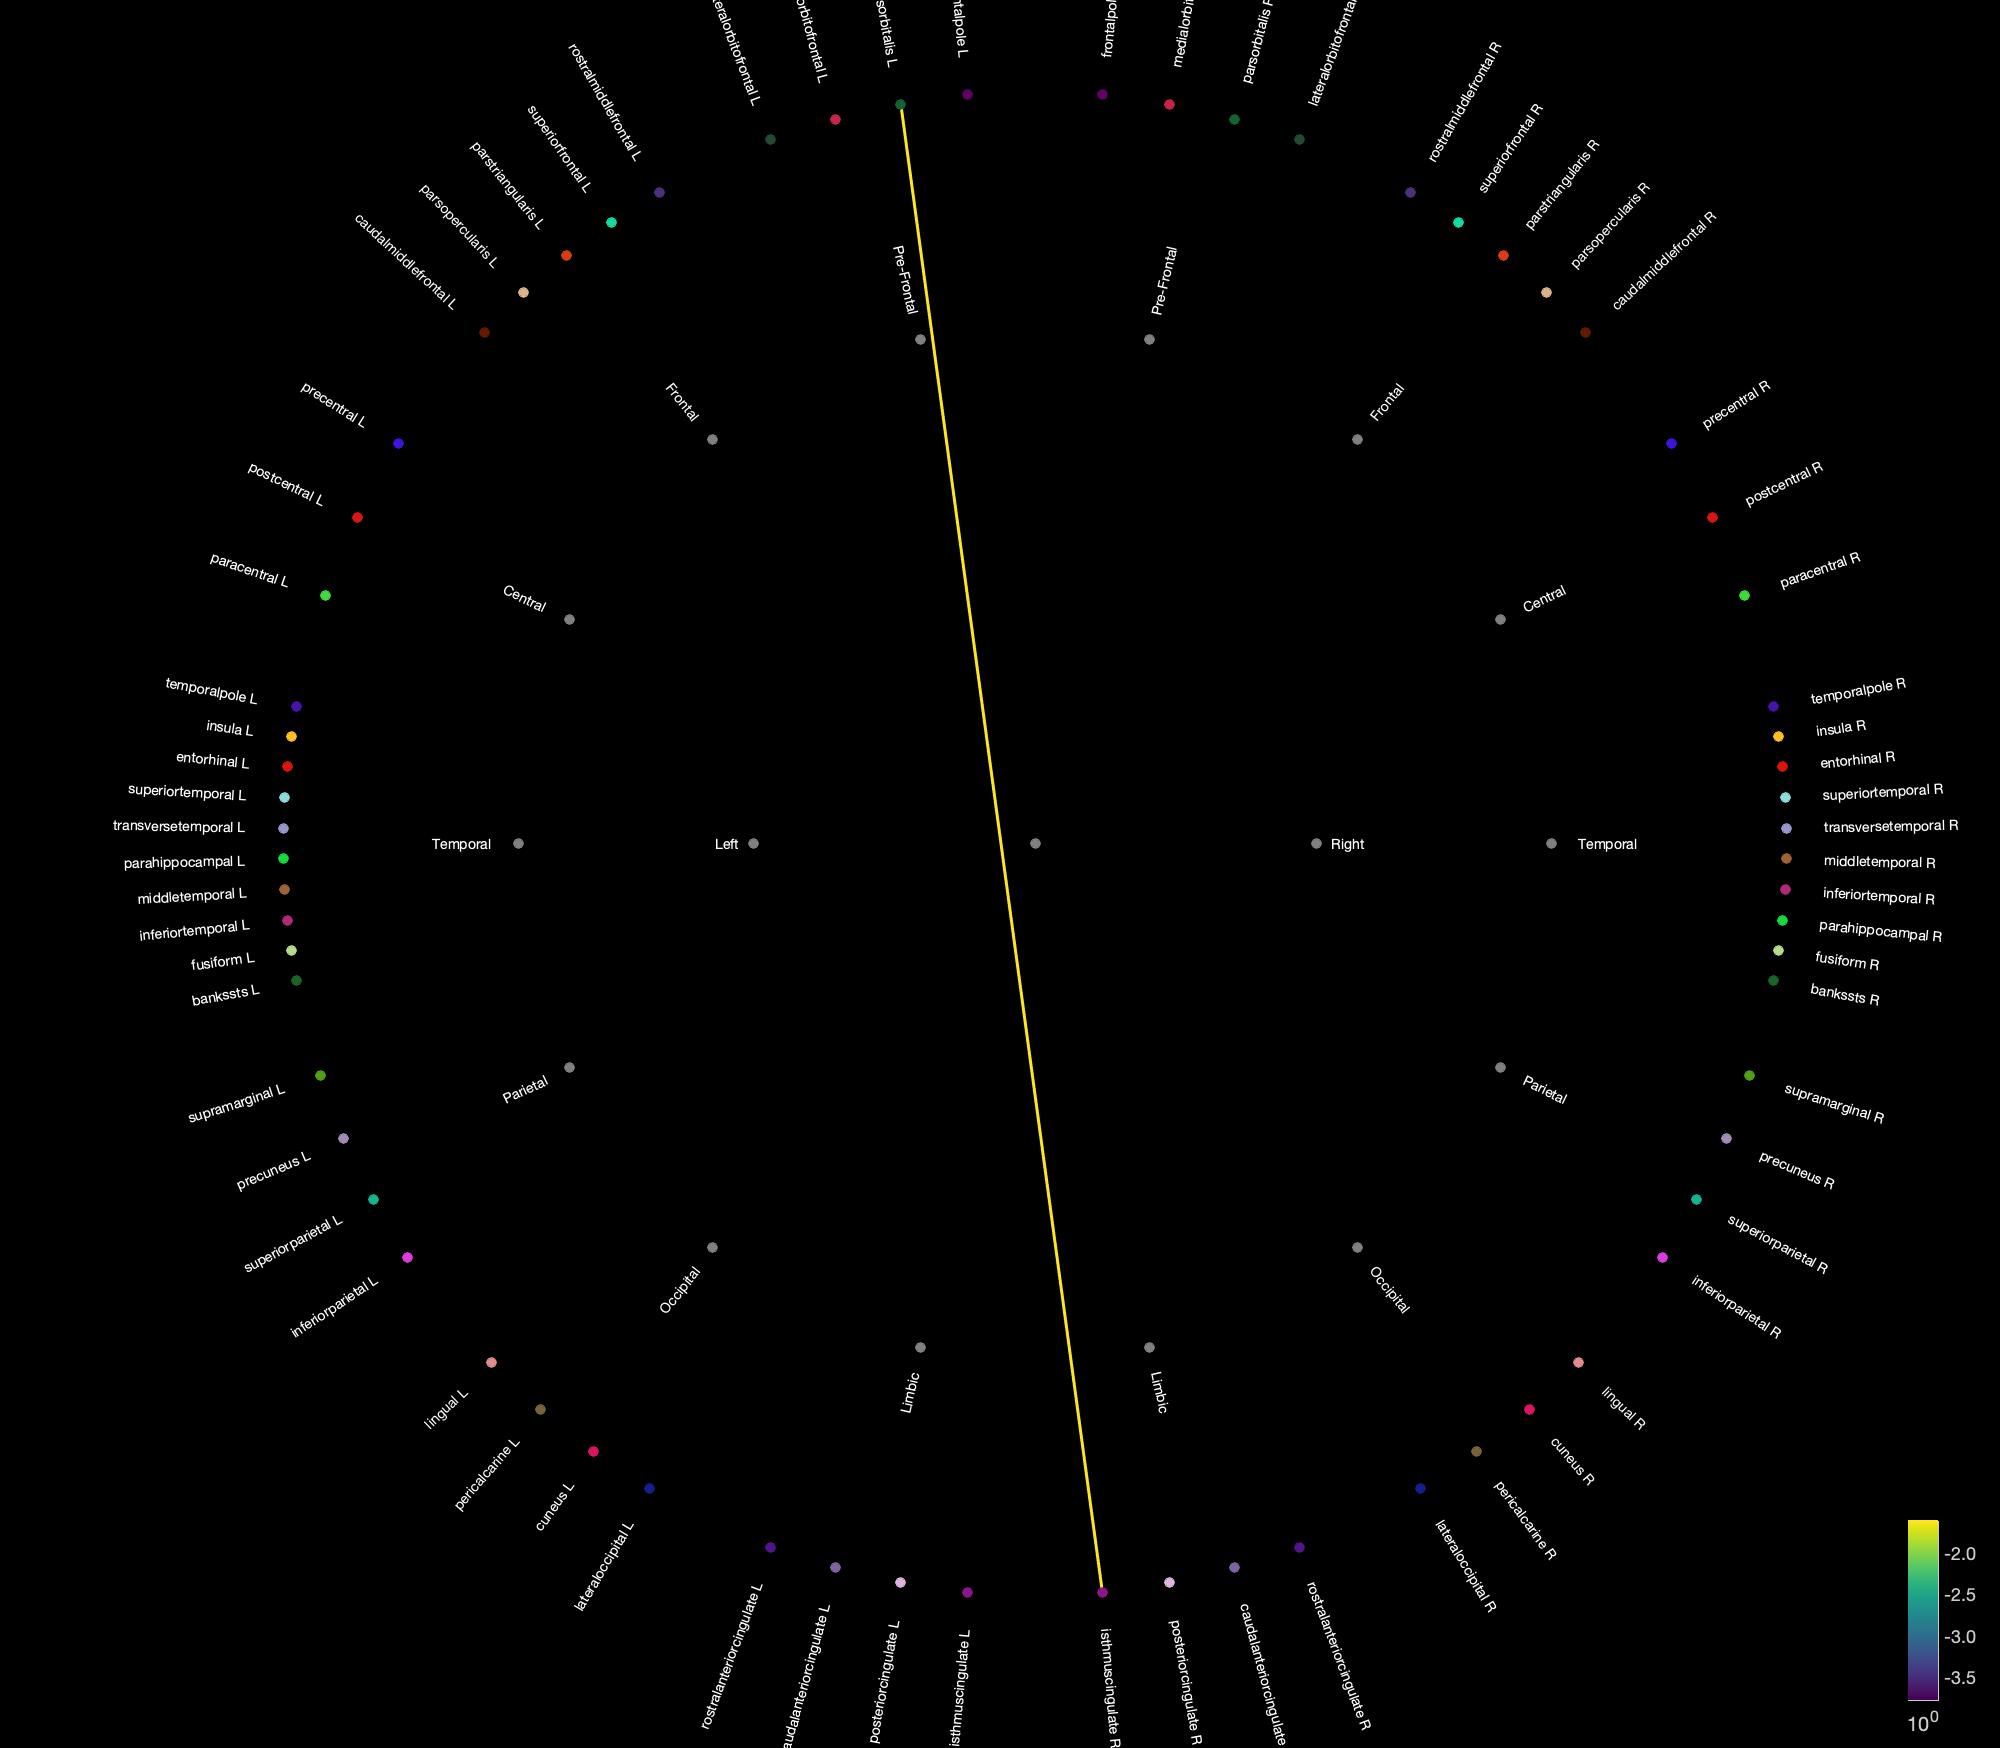
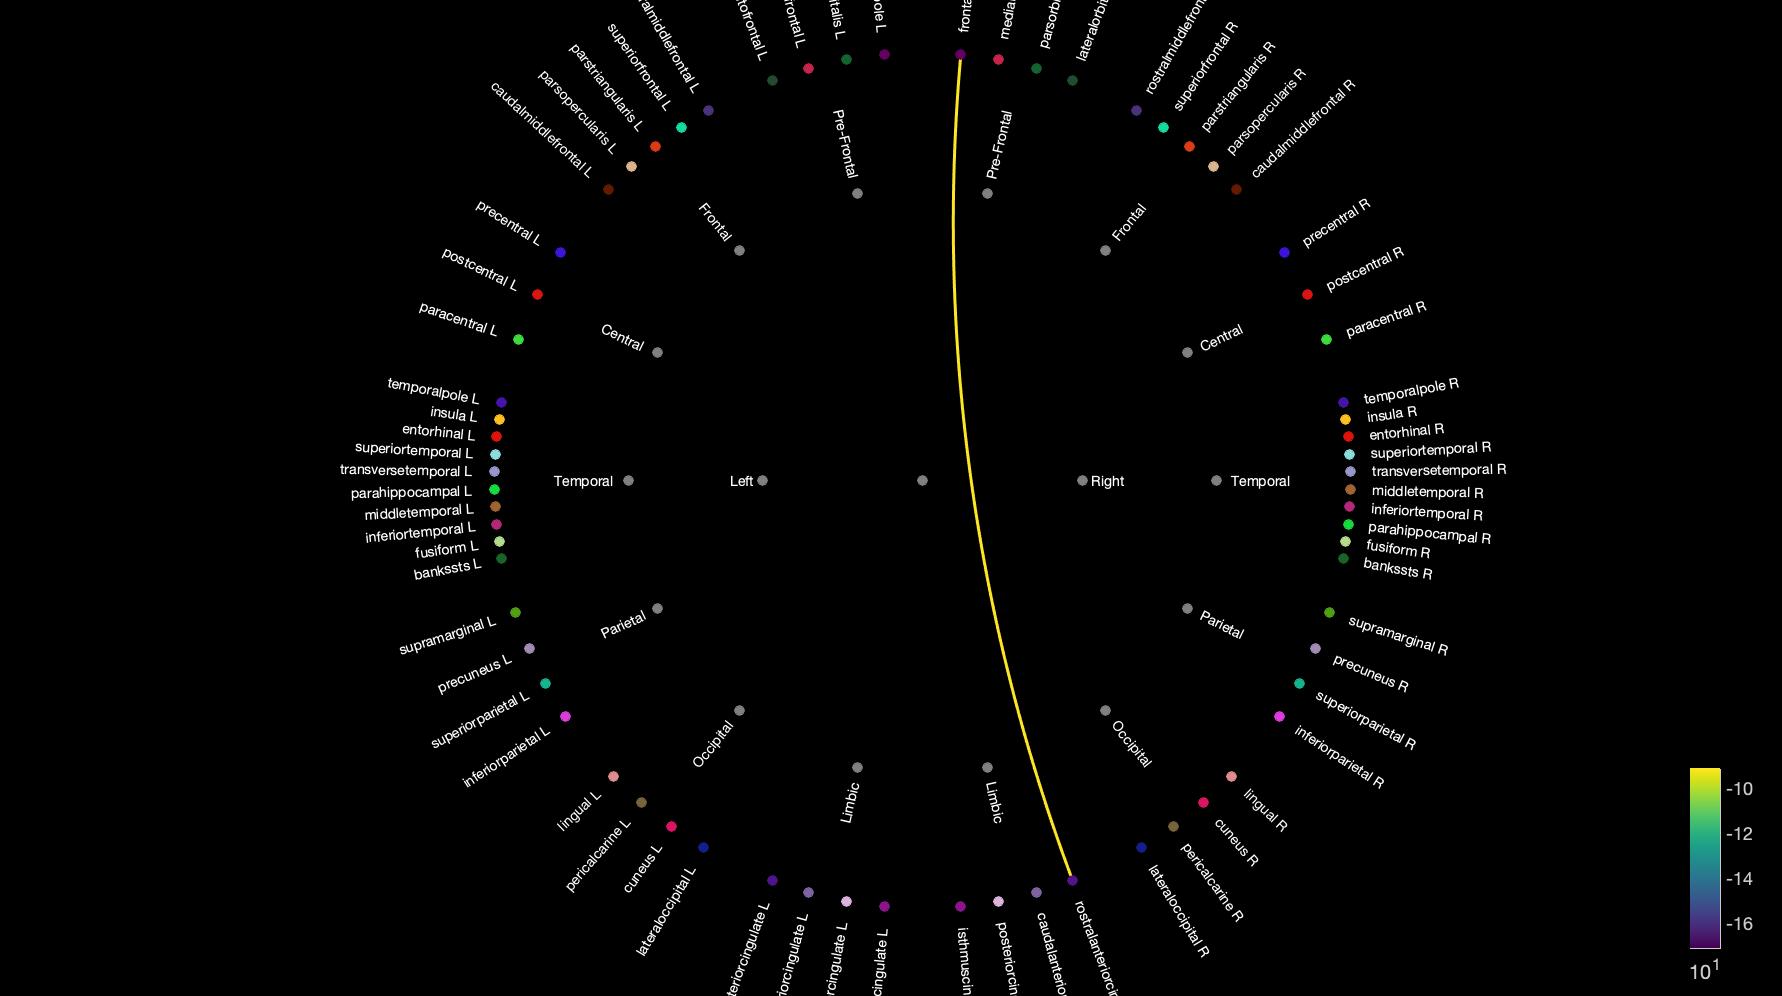
I am not sure what a negative intensity threshold indicates? Is it an indicator of the direction in which the connectivity is changing (so a negative value indicates that there is a decrease in connections from condition A to B?