Dear all, I have collected resting state EEG data on EGI 128 channel system under two conditions (pre and post meditation based intervention).
So I have two resting state files per subject and I have performed whole brain functional connectivity (FC) analysis on these EEG files (Amplitude envelope correlation, Desikan-Killany atlas) and now my purpose is to observe if there are any differences between these two conditions with respect to whole brain FC.
My specific questions pertain to the analysis and interpretation of the same:
What is the best way to test the statistical difference between the two conditions, do I as suggested in the tutorial- average the connectivity matrices for the two conditions and run a test of difference of means, or is there a better way?
When I take the average of these two conditions for all subjects and compute the difference between these two averages- how do I interpret the resulting graph? What does the difference of two connectivity graphs indicate?
Is there any reading material/ publication from where I can get further details on these methods for my own understanding as well as the publication I intend to write from these results.
What is the best way to test the statistical difference between the two conditions
Non-parameteric paired test across subjects (FilesA=Condition 1, one connectivity file per subject; FilesA=Condition 2, one connectivity file per subject)
do I as suggested in the tutorial- average the connectivity matrices for the two conditions and run a test of difference of means, or is there a better way?
What tutorial are you referring to?
When I take the average of these two conditions for all subjects and compute the difference between these two averages- how do I interpret the resulting graph?
Differences of connectivity measures after difficult to interpret directly.
What you are interested to know is whether these differences are significant across subjects.
Is there any reading material/ publication from where I can get further details on these methods for my own understanding as well as the publication I intend to write from these results.
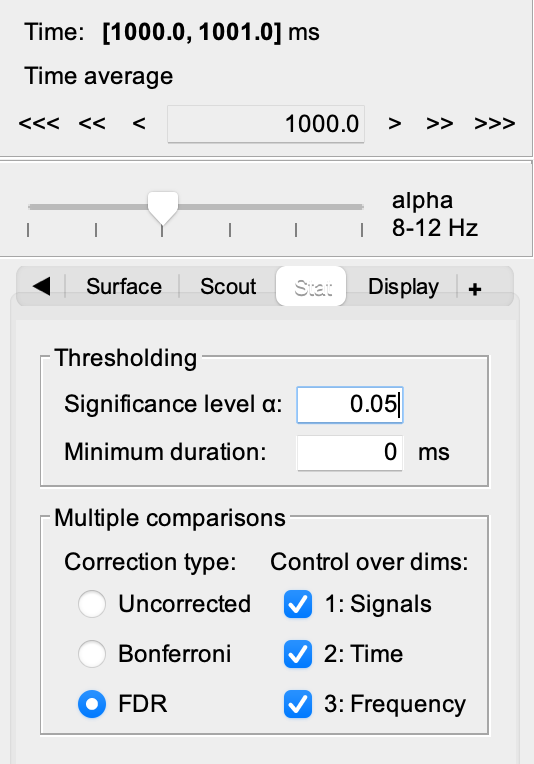
I had the run the permutation based paired test between the two conditions as suggested. In the stats section of the output/results file, I can see the option to control across three different dimensions: time, frequency and signal in the multiple comparisons section [screenshot attached].
I am not clear about what it means to 'control for dimensions' and what is referred to as 'signal' in this context. Is it referring to the adjacency matrix?
I am not clear about what it means to 'control for dimensions' and what is referred to as 'signal' in this context. Is it referring to the adjacency matrix?
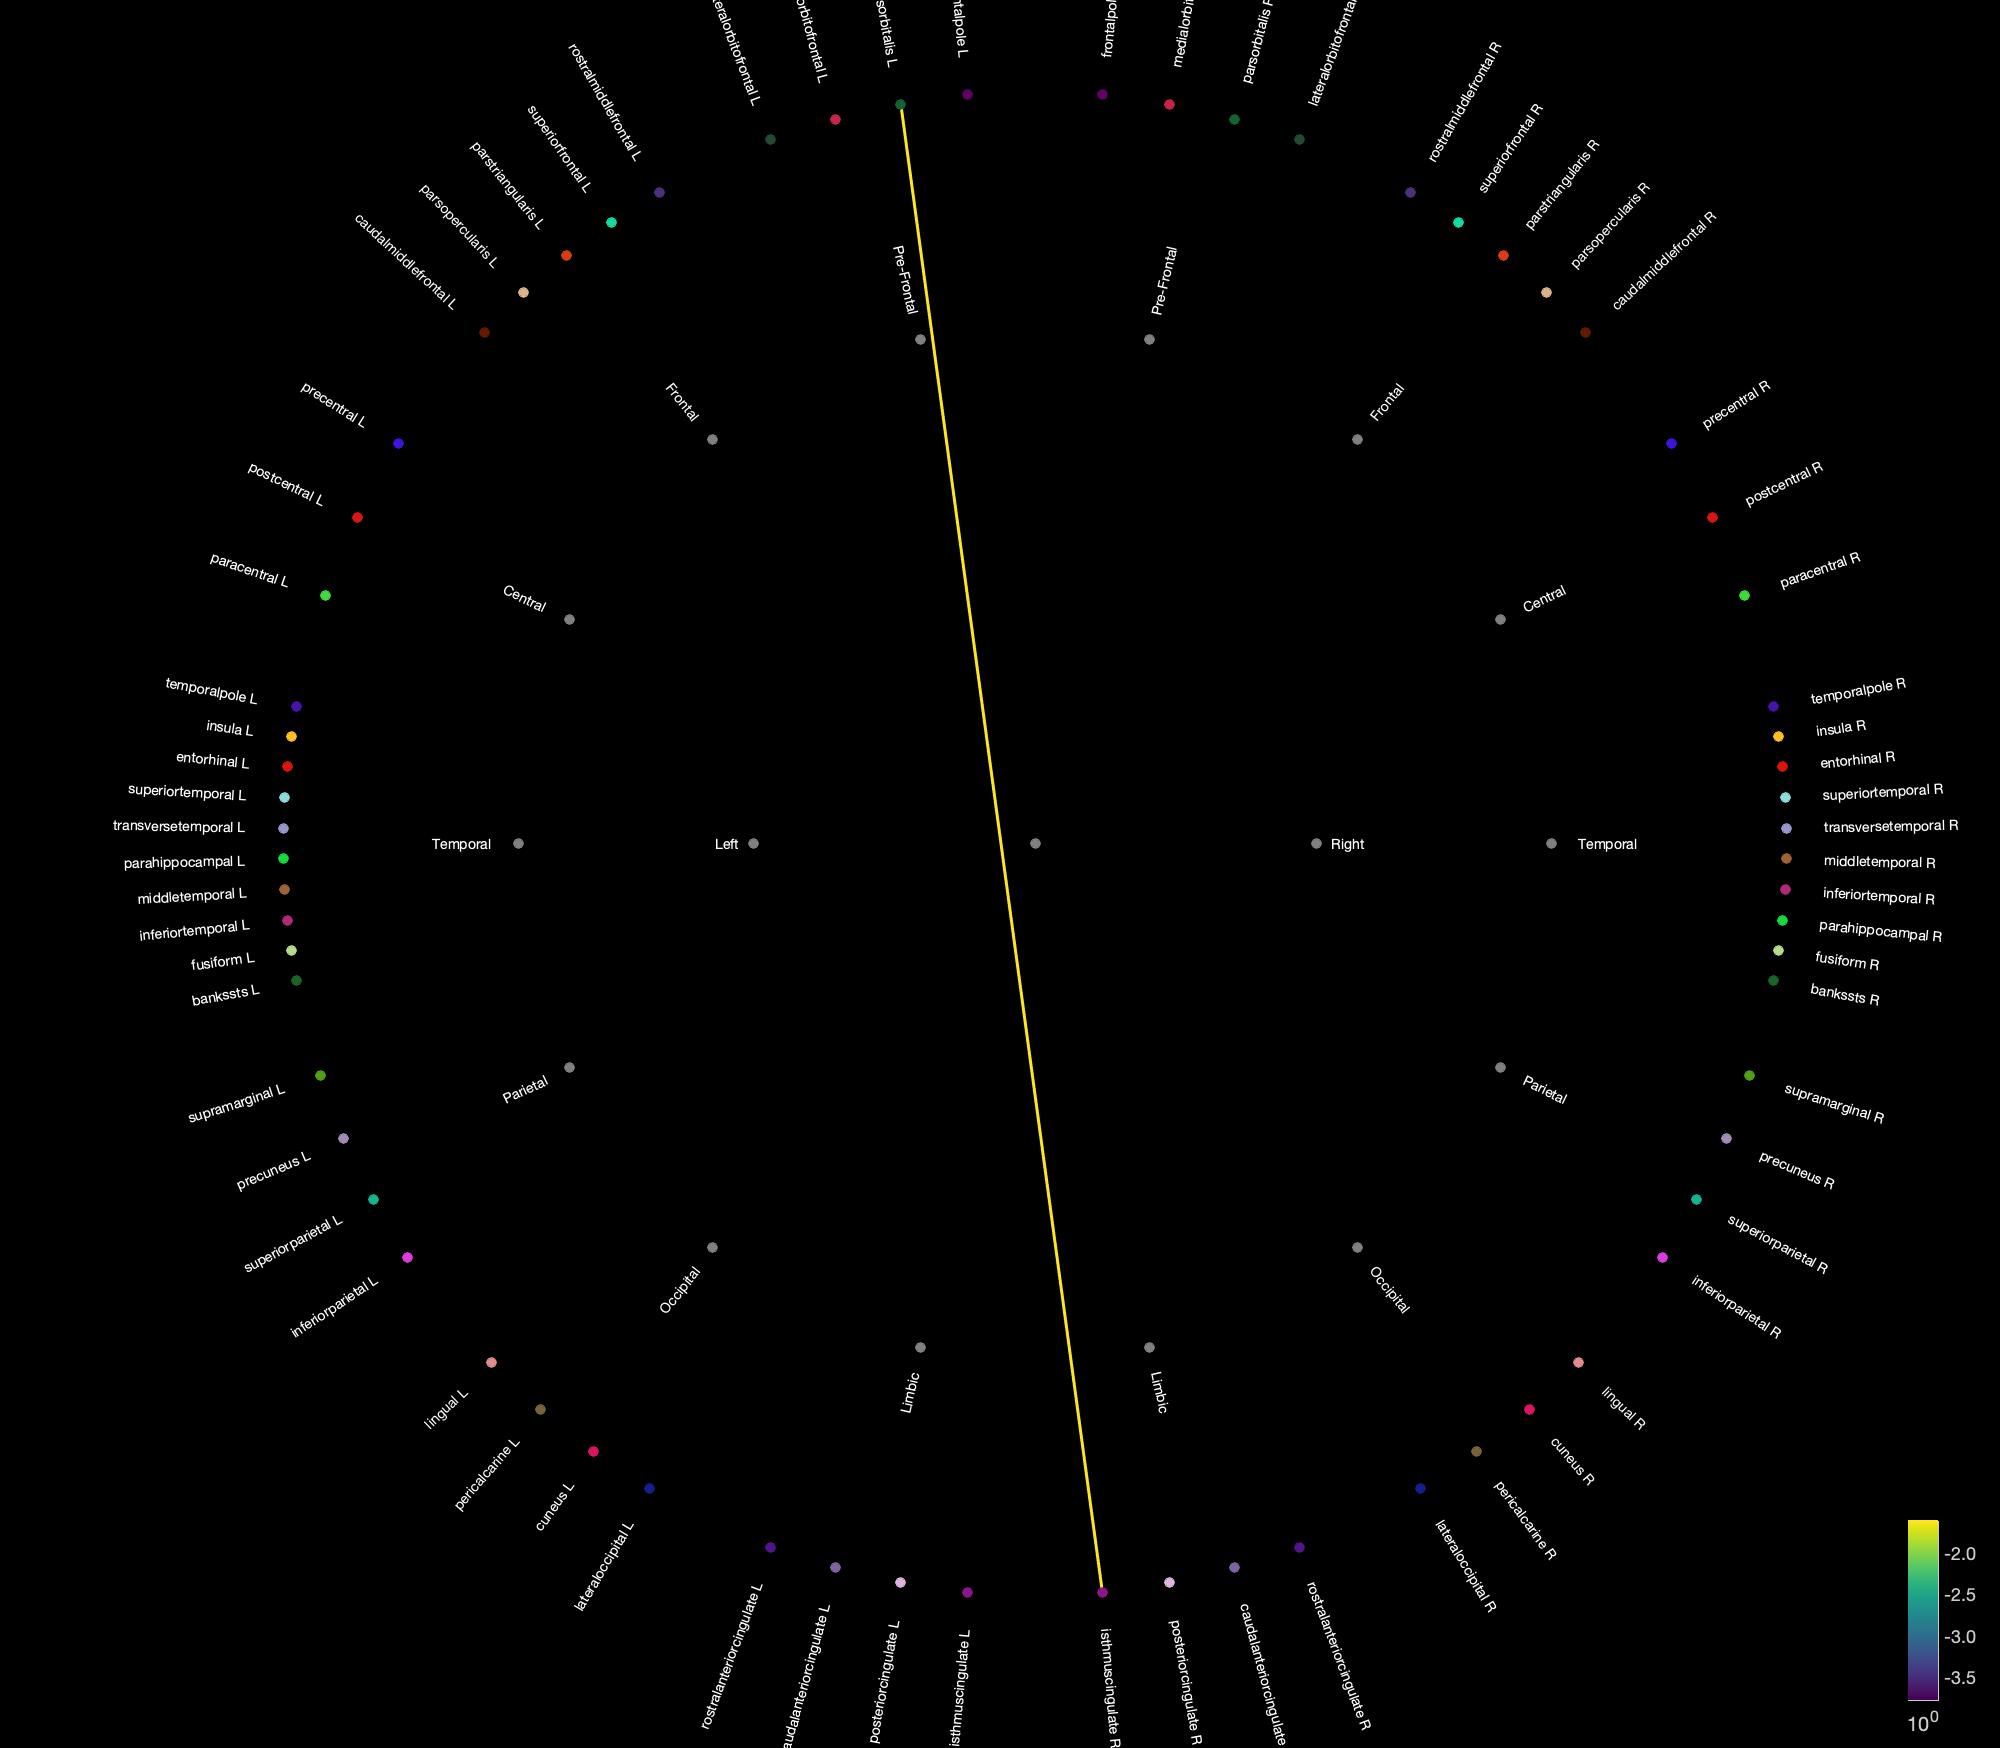
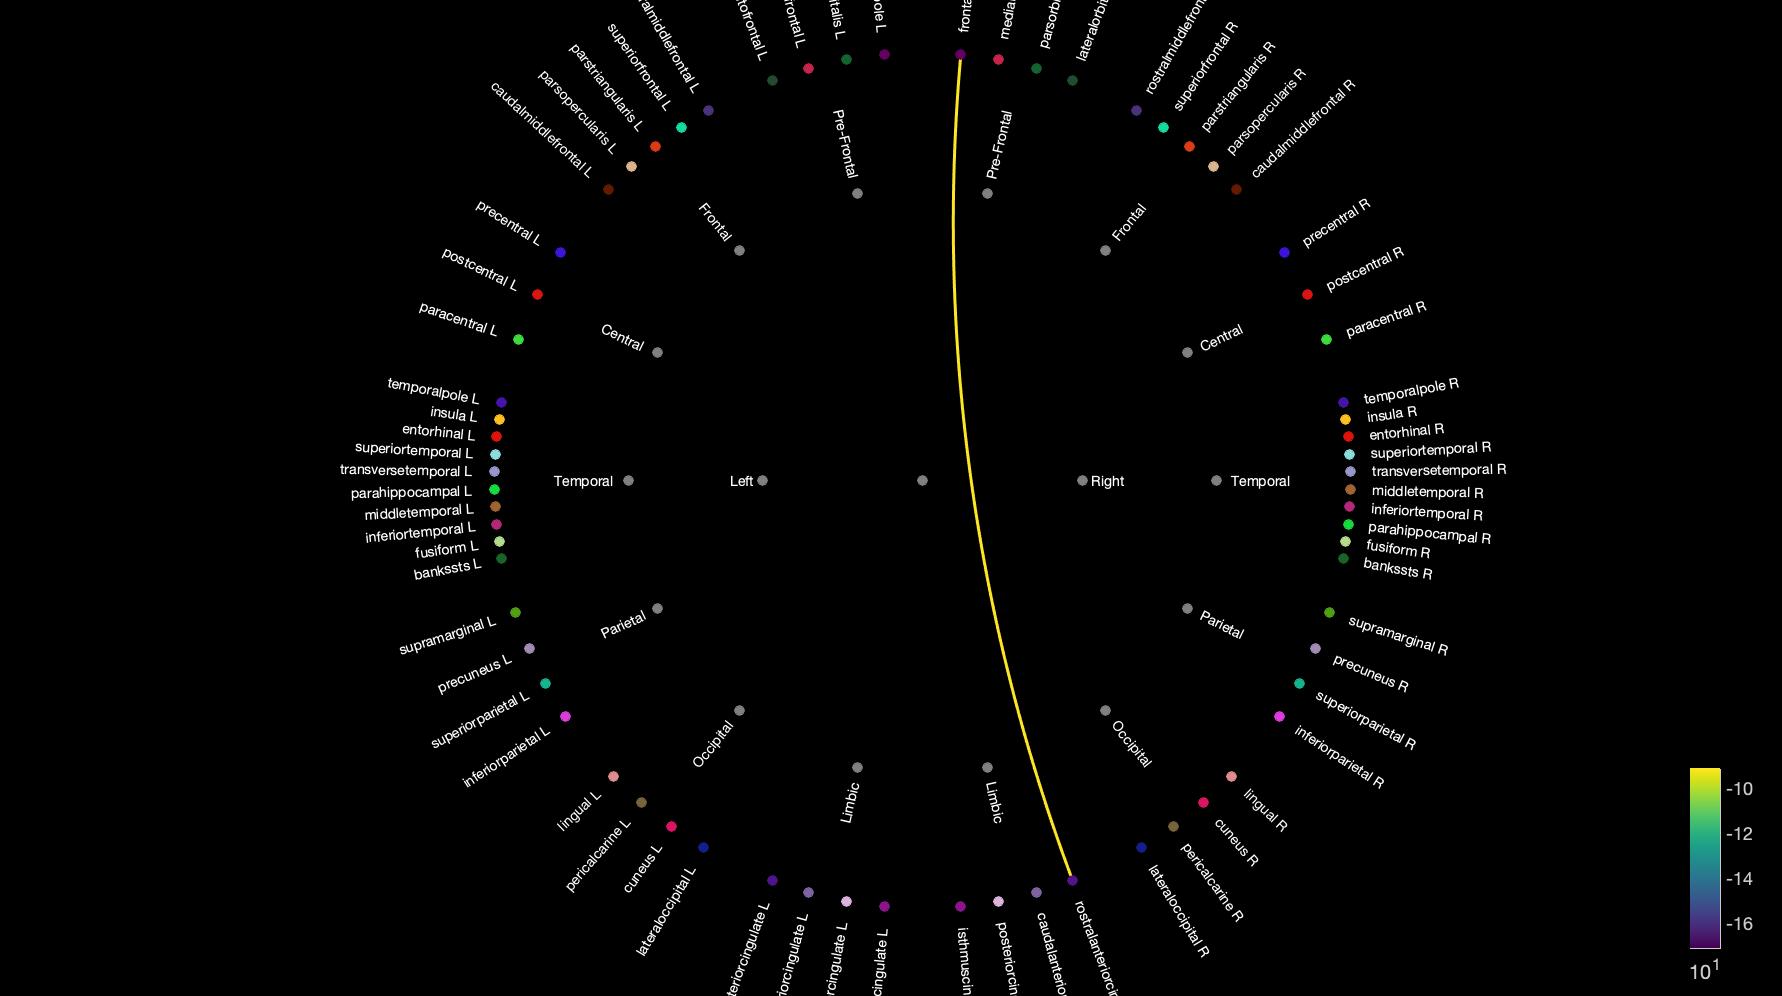
Thanks again Francois. One more query, I have run the paired permutation test for the two conditions as suggested (both t-test, and Wilcoxon sign test) and the intensity thresholds that I am getting in the connectivity graphs are negative (screenshots attached).
I am not sure what a negative intensity threshold indicates? Is it an indicator of the direction in which the connectivity is changing (so a negative value indicates that there is a decrease in connections from condition A to B?
The values displayed for a t-test are the t-values, only where the corresponding corrected p-values are below the threshold defined in the Stat tab. T-values can be positive or negative.