When the data is imported from a .mat file, it is assumed it is EEG.
As such none for units, it is indicating that the units for this "EEG" channel will be guessed.
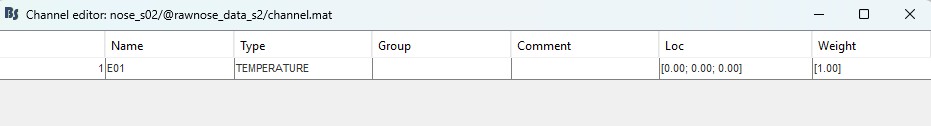
So, once you have imported your raw data, double-click the channel file to change its type to TEMPERATURE. While this will not set the units to °C in the plot, it will not choose EEG units.
Here, it seems that the DC removal option (DC button in the Record tab) is set.
This is why the signal fluctuates around zero.
The units, as mentioned above, come from the channel type.
Thank you very much for your quick reply. I manually changed the channel type to TEMPERATURE (it was not among the predefined options, so I forced it by pressing enter).
Regarding the DC removal option, yes—it is currently enabled. If I disable it, the entire signal disappears from the displayed time series.
I was wondering if there is a way to display the original units in Celsius on the y-axis. For example, would it be feasible to:
Import the temperature data in Brainstorm and choosing volt as amplitude unit, then export this data (on this participant, they range from -100 to +100)
Subtract the original raw values from the volt-based data,
Re-import the adjusted data into Brainstorm?
My assumption is that this would restore the scale to match the original raw data in Celsius (but I’ll have to try).
May I ask if there is a way to zoom in or view the signal in greater detail? I tried using the commands in the bottom-right corner, but I couldn’t get it to work.
I also created some epochs to check how they are displayed, and I noticed the following:
There seems to be a trend toward negative values, even though I did not alter the raw data (and there are no negative temperature values in my dataset). I double-checked whether DC offset removal was active, but it doesn’t appear to be the case.
I hadn’t noticed that the channel type changed after importing epochs. Yes, I am removing the DC offset when importing epochs, and I can confirm that everything looks fine. Below you can find the same epoch displayed without and with DC offset removal.
After changing the channel type to TEMPERATURE, I noticed that the signal is now displayed in green instead of black. Is there a way to change the signal color back to black?
It was black as sensor data from EEG, MEG and iEEG is black for all channels.
In this case, it's green as it is not one of the above (nor NIRS).
All figures in Brainstorm are Matlab figures, you can either change the color using the Matlab GUI to edit figures. Right-click on the figure then Figure > Matlab controls then in the menu View in the top toolbar open the Plot browser and Property editor.