Dear Brainstorm experts,
I've performed source analysis in my sample size and everything seemed to be smoothly: import anatomy folder, import eeg, import eeg channel location, compute noise covariance from eeg recording, create head model, and finally run the source analysis (dSPM, constrained).
However for all my subjects I got this weird results (please see attached image).
Could you please give me an insight on the reason on why I got this map.
Thanks in advance
Dave
Indeed. Did you verify that the eeg electrodes are properly positioned on the scalp? You can generate a view with a right click over the channel file and MRI Registration > Check.
Also, make sure that the color scale for sources is adjusted to the data (it should be by default): right click over the colobsar and colormap source > Maximum: local.
We’ll take it from there.
Hello Sylvain,
thanks for your prompt response. I've checked out the electrodes position and everything seems fine for me (please see attached image)
I've also played a little bit with the colorscale as you suggested but nothing changed for me
I've also tried to upload everything from the beginning but nothing has changed.
What do you think?
Dave
Thanks.
What regions do you expect to see active at the main peaks around 100ms and 200ms ?
What do you use for estimating noise covariance? I can recommend you compute one from the baseline of all single trials.
You can also compute a min-norm source model with Brainstorm to see whether if there is an issue with dSPM.
Thanks again,
I’m expecting activity in either the right angular gyrus or the middle frontal regions. The thing is that for all subjects I got this scatter results which is completely no-specific (I cannot see a network engagement).
As for the noise covariance, I had been using the baseline of all trials as you suggested
What do you mean for a “min-norm source model”? Isn’t the one that I’ve performed with dSPM?
Thanks again
Davide
Sorry, I meant that after selecting Minimum-norm imaging as Method, you would pick Current density map as measure.
Also, what is the reference used for the recordings? Make sure it matches that used by Brainstorm for source modeling. This info is shown in the channel file (right click over it and select Edit Channel File)
Sylvain,
I followed your suggestions (thanks a lot agan btw).
As for the current density I got the same weird map. I mean the source activation is scattered and doesn't reflect a network activity.
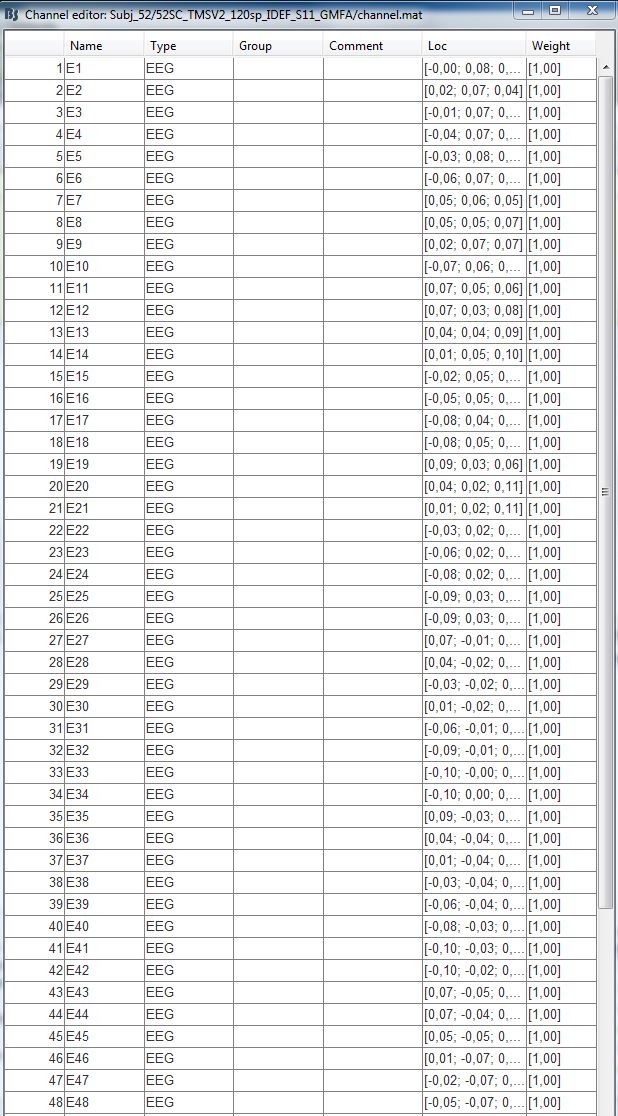
As for the channel file, please find attached my channel location file
I'm not sure whether the reference used for the recording matches with the one used by brainstorm. Maybe this might be the problem with the source. How can I get this information?
Thanks again
Dave
For the channel positions, Sylvain meant: right-click > MRI registration > EEG: Check (not Edit channel file).
Double-clicking on the channel file would do it as well.
To check that the position of the EEG electrodes is correct, you should try looking at the 2D topographies at the first peak in your ERP.
If it’s totally scattered, with adjacent points that are completely dissimilar, there could have been a problem with the order of the vertices in the cortex surface at some point.
Have you tried starting over the analysis completely from the beginning (creating a new subject in the database)?
Have you tried with a different subject?
Have you followed all the introduction tutorials using the example dataset before trying to process your own recordings? (section “Get started” on the tutorials page: https://neuroimage.usc.edu/brainstorm/Tutorials)
Dear Francois,
thanks for your reply!
I’ve tried to perform this analysis in other 8/9 subjects but I got the same weird output. I’ve also tried to starting over from the beginning by following your tutorial but nothing has changed.
As for the electrode position, it looks fine for me, I made a script on matlab to export the .txt files from my neuronavigator and everything went pretty smoothly.
I was thinking whether it might be an issue with the MATLAB version (I’m using R2013b).
Otherwise nothing else strike my mind 
Do you have any suggestions?
Thanks again for your support
Dave
Please post two screen captures:
- the position of the electrodes on the head
- the 2D topography of the EEG at the first peak of the ERP
Have you followed all the introduction tutorials using the example dataset before trying to process your own recordings? (at least until #23)
Have you read the EEG/Epilepsy tutorial after that?
https://neuroimage.usc.edu/brainstorm/Tutorials/Epilepsy
Figures a lot prettier after Matlab 2014b, but it should work correctly with 2013b.
Dear Francois,
please find attached the screeshot that you asked before
As for the tutorial, at the beginning of my experience with brainstorm I followed the tutorial by using your example dataset
Dave
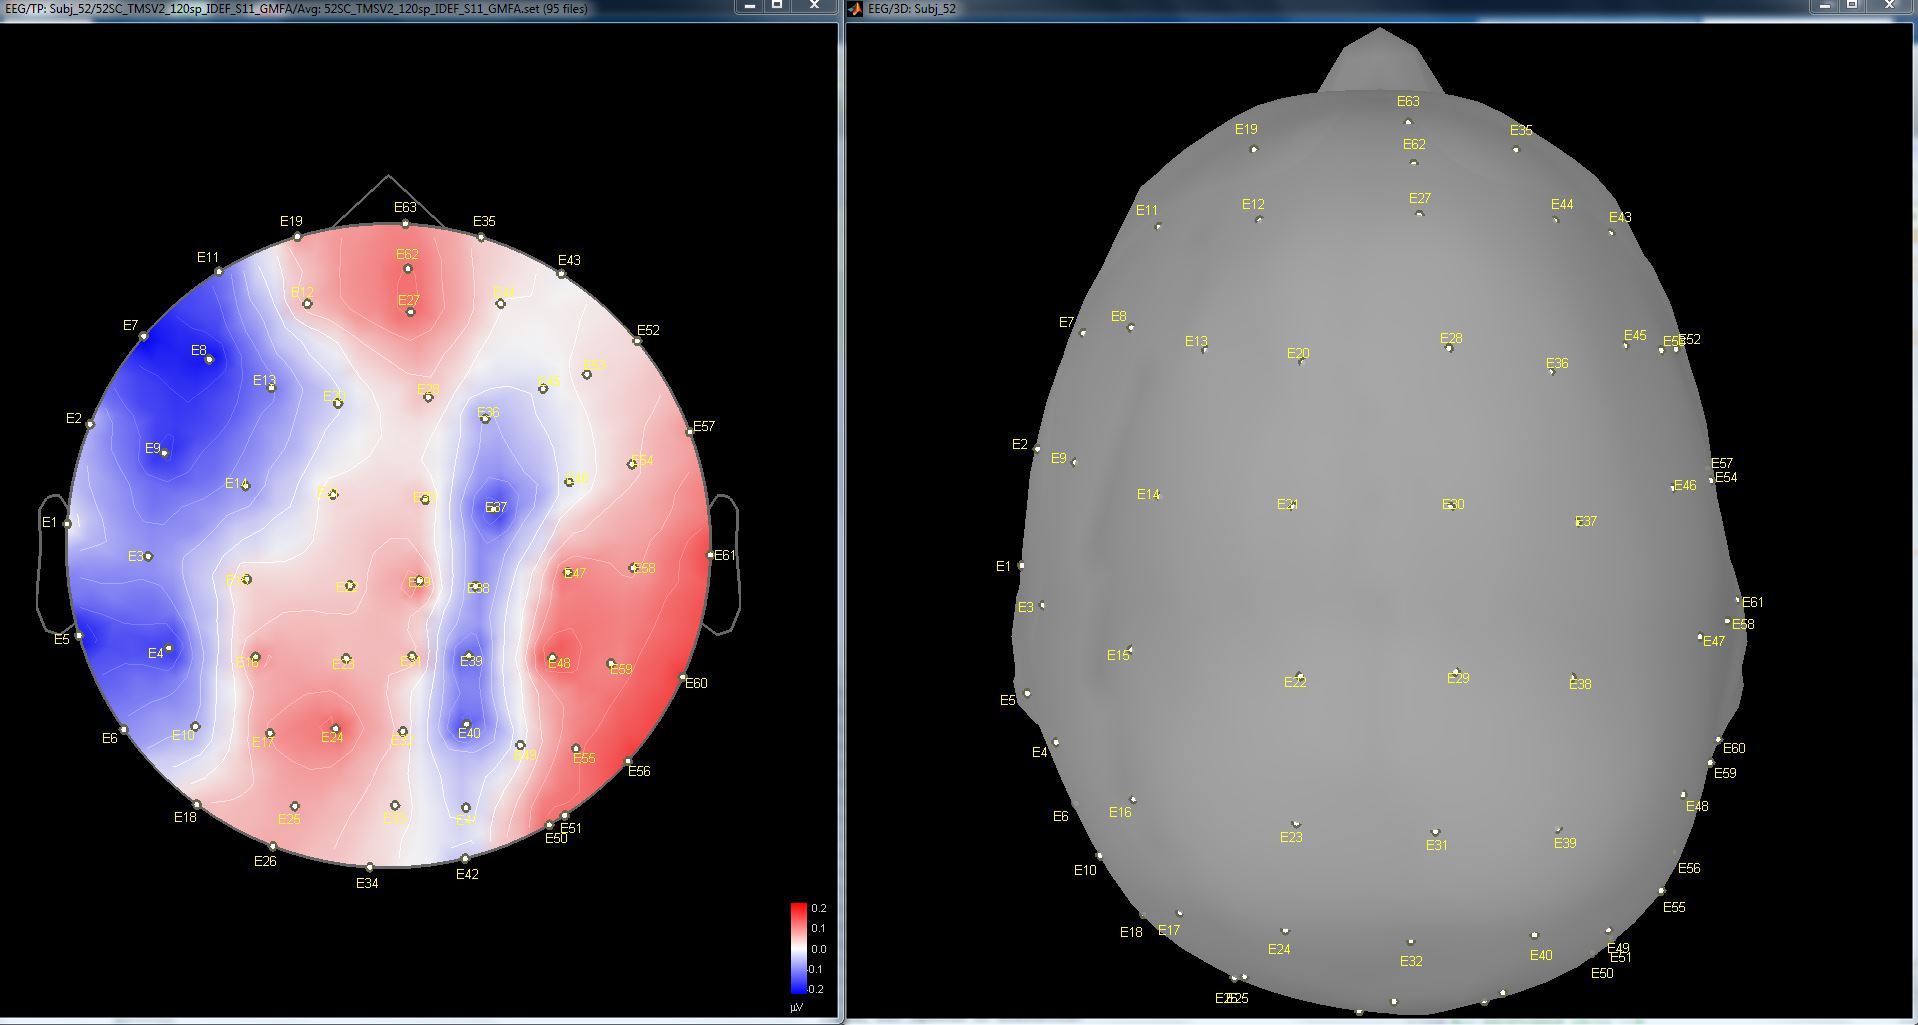
It looks like the scalp topographies are wrong/odd.
Press CTRL E twice over the 2D plot to display the channel names where they are located and verify that their locations are where you expect them to be. For instance E37 over right frontal, etc.
Hi Sylvain,
Please find attached the image. Everything seems fine
Thanks
Dave
The electrodes are indeed on the scalp but is the ordering/location identical as when data was collected? For instance, are you certain E19 is a left frontal electrode?
The topographies are indeed suspicious.
How did you get the positions of the electrodes?
I’ve imported the electrodes coordinates in MATLAB and convert them by using “cs_convert” with the individual MRI (exported by Brainstorm).
Then I’ve save the file as .txt and import the new channel location in Brainstorm. It seems ok for me, I mean the electrodes position fits the scalp perfectly.
Dave
The position of the electrodes is suspicious (I mean the order or the electrodes in the channel file), double-check what you are doing.