Hello,
I’m trying to apply statistical threshold (run process) to source (test against baseline).
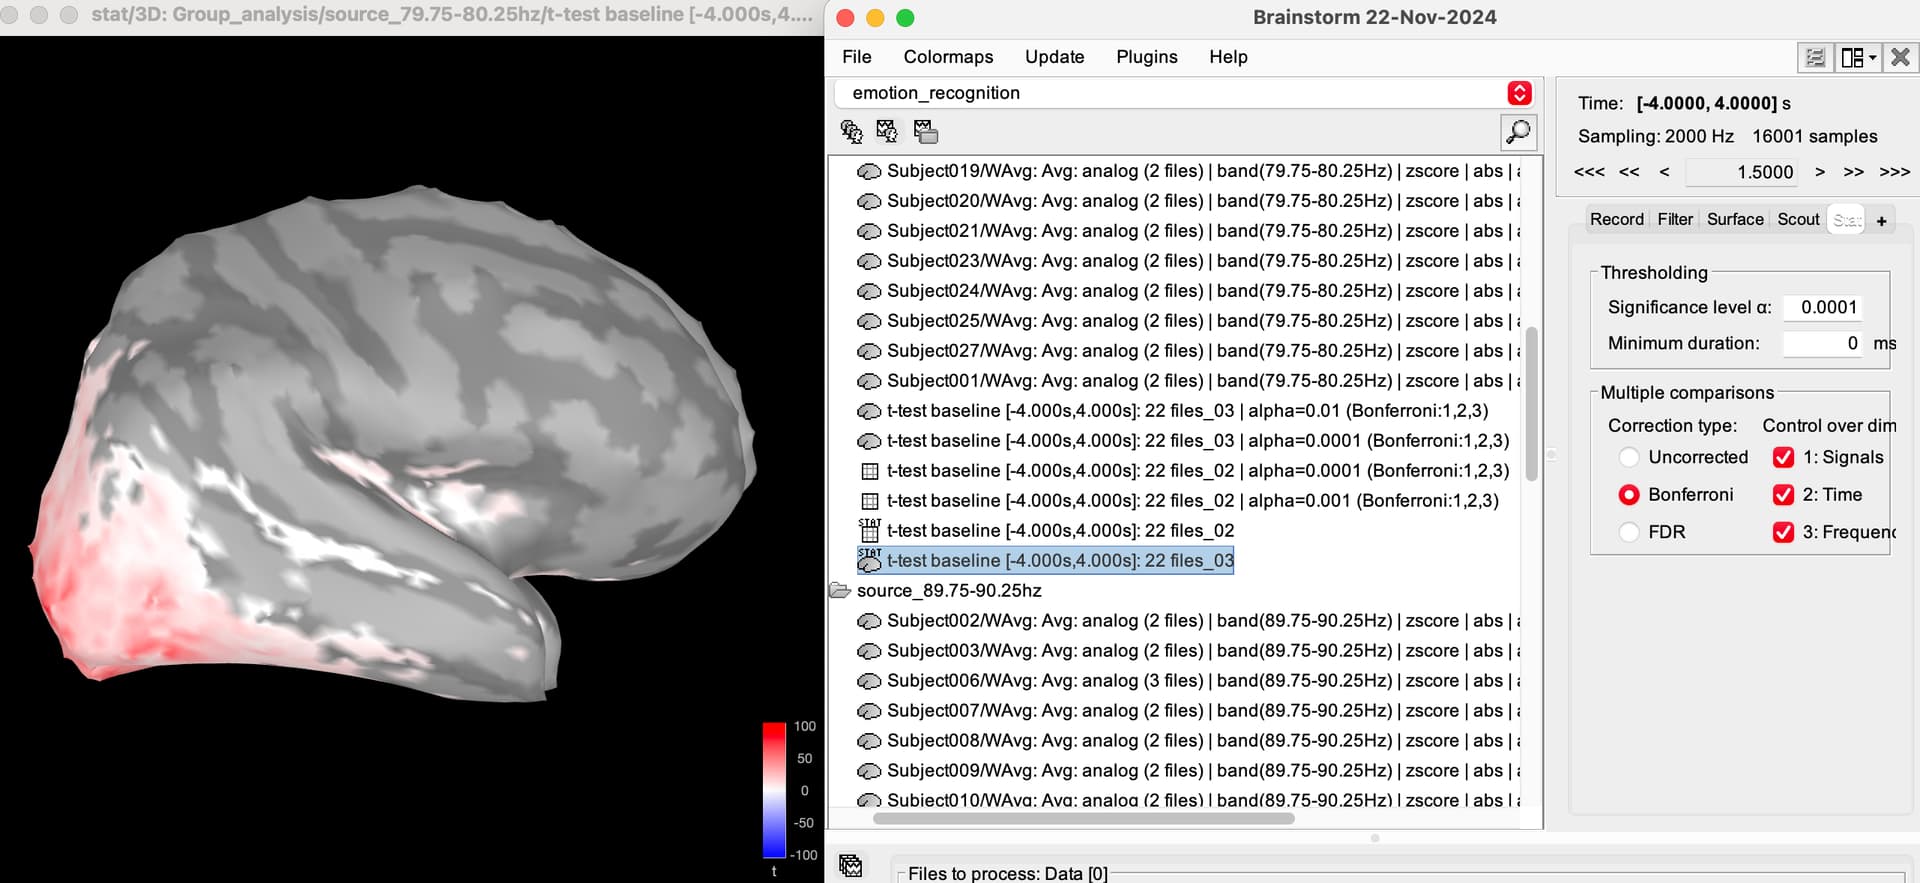
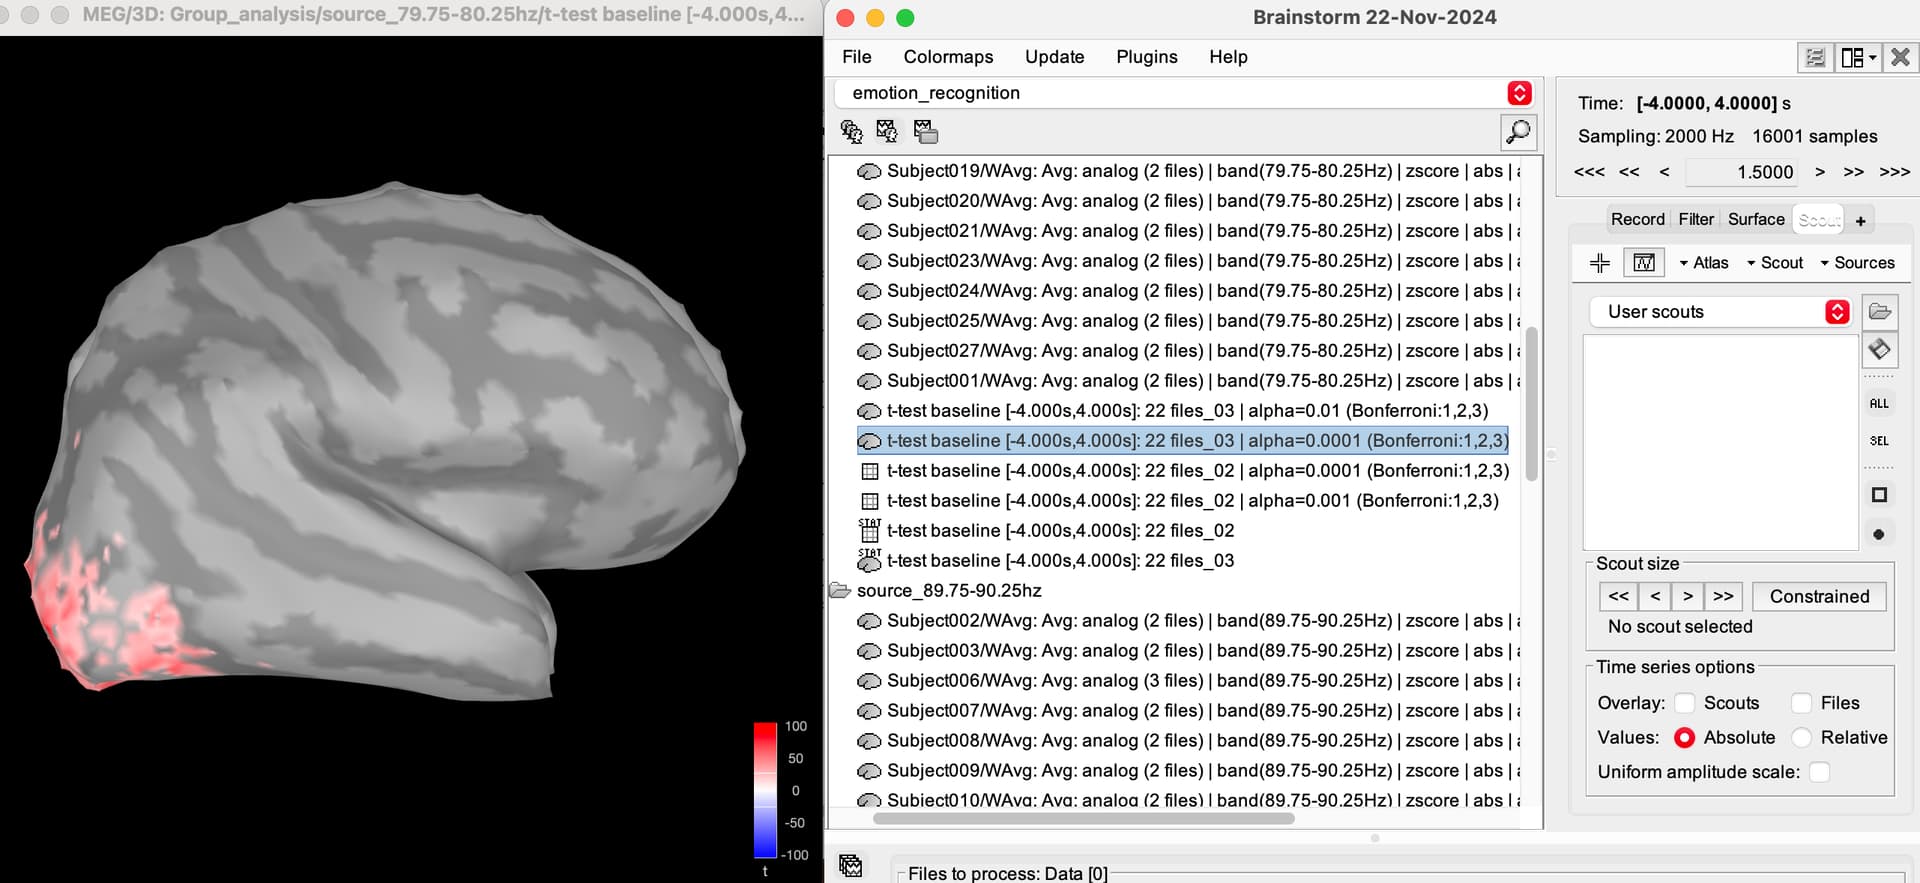
But why the two results look so different?
- before applying threshold, parameters: a=0.0001, bonferroni, control over dim(3 all checked)
- after applying threshold, the setting parameters are the same with the above ones
The real-time setting of parameters in the first picture didn’t work?
I’ve tried different a (the results of a=0.0001, 0.001, and 0.1 are different)