Hi everyone,
I have pre-processed and epoched my data on BS and then scripted it for Fildtrip(FT) further analysis. I'm plotting Time-Freq maps for each single subject in FT for more efficient visualization. The following code is giving the required plots but it is only saving TF maps for first subject only. I need to save individual plots for all subjects. The script should plot and save all plots at once for single subjects across Spatial and Temporal conditions.
Any suggestion where could be the mistake in the code and for correction? Uploading this here coz community is really responsive here, so quick answer would be really appreciated.
Thanks in advance
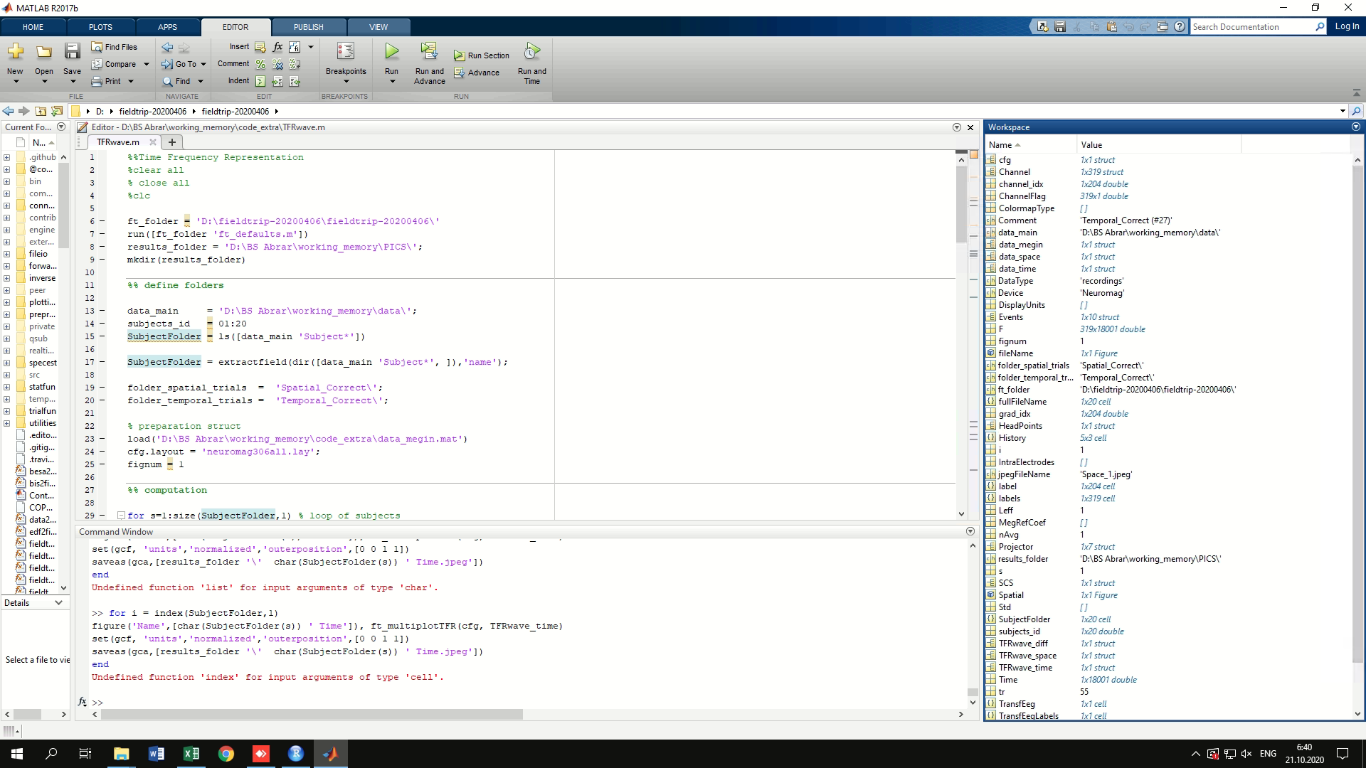
In the screenshot you can see the variables in workspace
Fiedtrip script and code
%%Time Frequency Representation
%clear all
% close all
%clc
ft_folder = 'D:\fieldtrip-20200406\fieldtrip-20200406'
run([ft_folder 'ft_defaults.m'])
results_folder = 'D:\BS Abrar\working_memory\PICS';
mkdir(results_folder)
%% define folders
data_main = 'D:\BS Abrar\working_memory\data';
subjects_id = 01:20
SubjectFolder = ls([data_main 'Subject*'])
SubjectFolder = extractfield(dir([data_main 'Subject*', ]),'name');
folder_spatial_trials = 'Spatial_Correct';
folder_temporal_trials = 'Temporal_Correct';
% preparation struct
load('D:\BS Abrar\working_memory\code_extra\data_megin.mat')
cfg.layout = 'neuromag306all.lay';
fignum = 1
%% computation
for s=1:size(SubjectFolder,1) % loop of subjects
clear data_space data_time

% prepare to build data strcut for space and time  condition
trials_space = ls([data_main char(SubjectFolder(s)) '\' folder_spatial_trials 'data*trial*mat'])
trials_time  = ls([data_main char(SubjectFolder(s)) '\' folder_temporal_trials 'data*trial*mat'])
load([data_main char(SubjectFolder(s)) '\' folder_spatial_trials 'channel_vectorview306_acc1.mat'])
labels       = extractfield(Channel,'Name');
grad_idx     = setdiff(1:306, 3:3:306);
% channel_idx = grad_idx(ChannelFlag(grad_idx)~=-1);
channel_idx = grad_idx; % index of gradiometer
label = labels(channel_idx);
% create space struct
for tr = 1:size(trials_space,1)
load([data_main char(SubjectFolder(s)) '' folder_spatial_trials trials_space(tr,:)])
data_space.trial{1,tr} = F(channel_idx,:);
data_space.time{1,tr} = Time;
end
% create time struct
for tr = 1:size(trials_time,1)
load([data_main char(SubjectFolder(s)) '' folder_temporal_trials trials_time(tr,:)])
data_time.trial{1,tr} = F(channel_idx,:);
data_time.time{1,tr} = Time;
end
data_space.grad = data_megin.grad;
data_time.grad = data_megin.grad;
data_space.label = label';
data_time.label = label';
%%
%ch = 100
%tr = 56
%figure,
%plot(data_time.time{1,1}, data_time.trial{1,tr}(ch,:))
%hold on
%plot(data_space.time{1,1}, data_space.trial{1,tr}(ch,:))
%for ch = 1:204
%for tr = 1:100
% valmax_time(ch,tr) = max(abs(data_time.trial{1,tr}(ch,:)));
%valmax_space(ch,tr) = max(abs(data_space.trial{1,tr}(ch,:)));
%% Compute Morlet Wavelet Time-Frequency (TF) Representations
cfg = ;
cfg.channel = 'MEG';
cfg.method = 'wavelet';
cfg.width = 3;
cfg.output = 'pow';
cfg.foi = 1:2:45;
cfg.toi = -6:0.05:12; %Epoch time (complete trial for correct trials only -6 to 12 seconds)
% cfg.toi = -1:0.05:5;
TFRwave_space = ft_freqanalysis(cfg, data_space);
TFRwave_time = ft_freqanalysis(cfg, data_time);
%% Plot TF Results with baseline norm.
cfg = ;
cfg.baseline = [-6 -5];
cfg.baselinetype = 'absolute';
cfg.zlim = [-5e-21 5e-21];
% cfg.xlim = [-1 5];
cfg.showlabels = 'no';
cfg.layout = 'neuromag306all.lay';
cfg.colorbar = 'yes';
figure('Name',[char(SubjectFolder(s)) ' Space']), ft_multiplotTFR(cfg, TFRwave_space)
set(gcf, 'units','normalized','outerposition',[0 0 1 1])
saveas(gca,[results_folder '' char(SubjectFolder(s)) ' Space.jpeg']) % visualize and save Time-Freq plots for Spatial trials for each subbject
figure('Name',[char(SubjectFolder(s)) ' Time']), ft_multiplotTFR(cfg, TFRwave_time)
set(gcf, 'units','normalized','outerposition',[0 0 1 1])
saveas(gca,[results_folder '' char(SubjectFolder(s)) ' Time.jpeg']) % visualize and save Time-Freq plots for Temporal trials for each subbject
%
TFRwave_diff = TFRwave_space; % visualize and save TF power difference for each subject
TFRwave_diff.powspctrm = (TFRwave_space.powspctrm - TFRwave_time.powspctrm)./(TFRwave_space.powspctrm + TFRwave_time.powspctrm);
figure,
cfg = ;
% cfg.zlim = [- 1 1];
cfg.colorbar = 'yes';
cfg.layout = 'neuromag306all.lay';
ft_multiplotTFR(cfg, TFRwave_diff)
set(gcf, 'units','normalized','outerposition',[0 0 1 1])
saveas(gca,[results_folder '' char(SubjectFolder(s)) ' Space-Time.jpeg'])
end
Best,
Abrar