Cannot display as connectivity graph

Hi Brainstorm experts,

I have done a statistic on my data. However, I cannot view the connectivity map on PTE data. I can view it as an image, just not as a connectivity graph. I try open for PLV, I can display both, just not PTE.

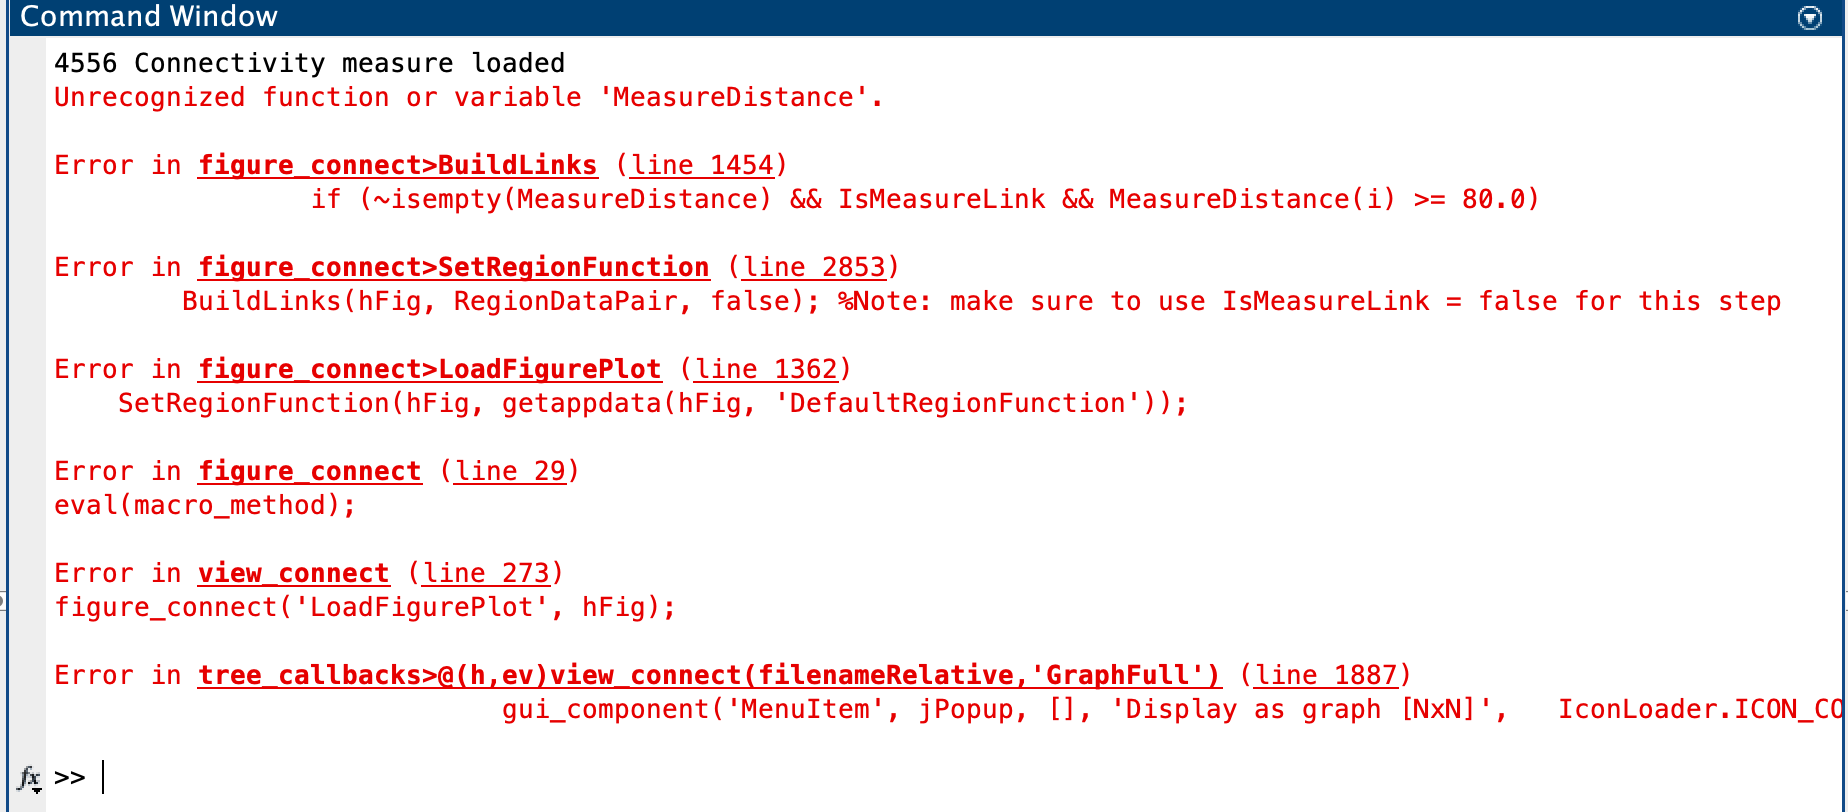
Unrecognized function or variable 'MeasureDistance'.

Error in figure_connect>BuildLinks (line 1454)
if (~isempty(MeasureDistance) && IsMeasureLink && MeasureDistance(i) >= 80.0)

Error in figure_connect>SetRegionFunction (line 2853)
BuildLinks(hFig, RegionDataPair, false); %Note: make sure to use IsMeasureLink = false for this step

Error in figure_connect>LoadFigurePlot (line 1362)
SetRegionFunction(hFig, getappdata(hFig, 'DefaultRegionFunction'));

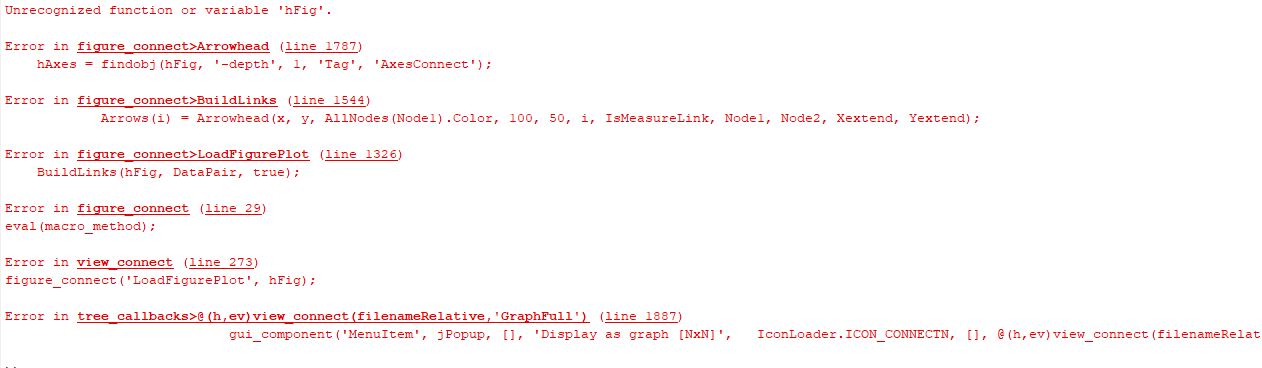
Error in figure_connect (line 29)
eval(macro_method);

Error in view_connect (line 273)
figure_connect('LoadFigurePlot', hFig);

Error in tree_callbacks>@(h,ev)view_connect(filenameRelative,'GraphFull') (line 1887)
gui_component('MenuItem', jPopup, [], 'Display as graph [NxN]', IconLoader.ICON_CONNECTN, [], @(h,ev)view_connect(filenameRelative, 'GraphFull'));

Hi Faizatul,

Be sure you're running the latest version of Brainstorm.
Menu Update > Update Brainstorm

1 Like

Hi Raymundo,
I am experiencing the same problem. I updated brainstorm just now and I'm still getting this error when I try to "display as a graph" to see the connectivity graph. This worked for me yesterday but not today.
Do you have any idea what could be wrong?

Can you post a screenshot with the error that is shown?


This is the error that I get when trying to view the connectivity graph.

The issue was related to plotting region links in the graph.
It should be fixed now, please update Brainstorm.
Thank you for reporting the bug.

https://github.com/brainstorm-tools/brainstorm3/commit/763d27027dbbf1552ce7fc9c04e44b879c8349c3

1 Like

Thank you so much, it works now.

Don't know if it is a bug or not, but I feel like it is also taking a lot longer to process the Bivariate Granger causality (spectral) NxN (as well as some other functions). Each time I stop (not always at the same time) the process it stops at the same spot which you can see here below.

Operation terminated by user during bst_mvar (line 132)

In bst_granger_spectral (line 200)
[transfers, noiseCovariance, order] = bst_mvar([X(iX, :); Y(iY, :)], order, inputs.nTrials, inputs.flagFPE);

In bst_connectivity (line 411)
[R, pValues, OPTIONS.Freqs] = bst_granger_spectral(sInputB.Data, sInputA.Data, sfreq, OPTIONS.GrangerOrder, inputs);

In process_spgranger1n>Run (line 97)
OutputFiles = bst_connectivity({sInputA.FileName}, [], OPTIONS);

In process_spgranger1n (line 27)
eval(macro_method);

In bst_process>Run (line 230)
OutputFiles = sProcesses(iProc).Function('Run', sProcesses(iProc), sInputs);

In bst_process (line 37)
eval(macro_method);

In panel_process1>RunProcess (line 124)
sOutputs = bst_process('Run', sProcesses, sFiles, [], 1);

In panel_process1 (line 26)
eval(macro_method);

In gui_brainstorm>CreateWindow/ProcessRun_Callback (line 773)
panel_fcn('RunProcess');

In bst_call (line 28)
feval(varargin{:});

In gui_brainstorm>@(h,ev)bst_call(@ProcessRun_Callback) (line 297)
gui_component('toolbarbutton', jToolbarA, [], '', {IconLoader.ICON_RUN, TB_SIZE}, 'Start', @(h,ev)bst_call(@ProcessRun_Callback));

What signals are you running this on? Recordings or sources?
If you could add some screen captures showing 1) the input files in the database and 2) the process options, it might help us suggest faster alternatives.

Hi Raymundo,

I still cannot view the graph after the update. Here is the screenshot

I apologize, I introduced this bug yesterday while fixing other bugs.
I fixed it here: https://github.com/brainstorm-tools/brainstorm3/commit/8a52a80318dad8c4b5bb42622c2eab121c82f4fe

Please update Brainstorm and try again.

Hi Brainstorm experts,

I am experiencing a problem after I updated brainstorm (version: 04-Oct-2022). When I try to "display as a graph" to see the connectivity graph, I have error messages as follows:

Dot indexing is not supported for variables of this type
Error: figure_connect>LoadFigurePlot (line 1203)
isVolumeAtlas = panel_scout('ParseVolumeAtlas', Atlas.Name);

Error: figure_connect (line 29)
eval(macro_method);

Error: view_connect (line 284)
figure_connect('LoadFigurePlot', hFig);

Error: tree_callbacks>@(h,ev)view_connect(filenameRelative,'GraphFull') (line 1919)
gui_component('MenuItem', jPopup, [], 'Display as graph [NxN]', IconLoader.ICON_CONNECTN, [], @(h,ev)view_connect(filenameRelative, 'GraphFull'));

Could you tell me a solution to the problem?

I added an extra test in the code, to check whether this Atlas variable is set or not: Bugfix: Display connectivity graph with empty Atlas · brainstorm-tools/brainstorm3@e8d719f · GitHub
Update Brainstorm to get this fix.

However, this might not solve your problem as there is maybe something wrong with this file.
I don't understand why it can have an empty "Atlas" field. If you are computing a full brain connectivity (15000 x 15000, which is not recommended), it should not run through this part of the code.

How did you create this file? (please explain step by step, with screen capture of the connectivity process options that generated it, and all the post-processing steps if any)
Can you please share this file here? (upload it somewhere and post the download link here)

Hi Francois,

By updating Brainstorm, the problem was solved.
Thank you very much for your help.

@usui22
I had to revert part of the changes that I made relative to your bug to fix another bug:

Please update Brainstorm again.
If you get a new error, I need to add a different fix, specific for your file.

How did you create this file? (please explain step by step, with screen capture of the connectivity process options that generated it, and all the post-processing steps if any)
Can you please share this file here? (upload it somewhere and post the download link here)