I recently used the CAT12 segmentation tool included in brainstorm.
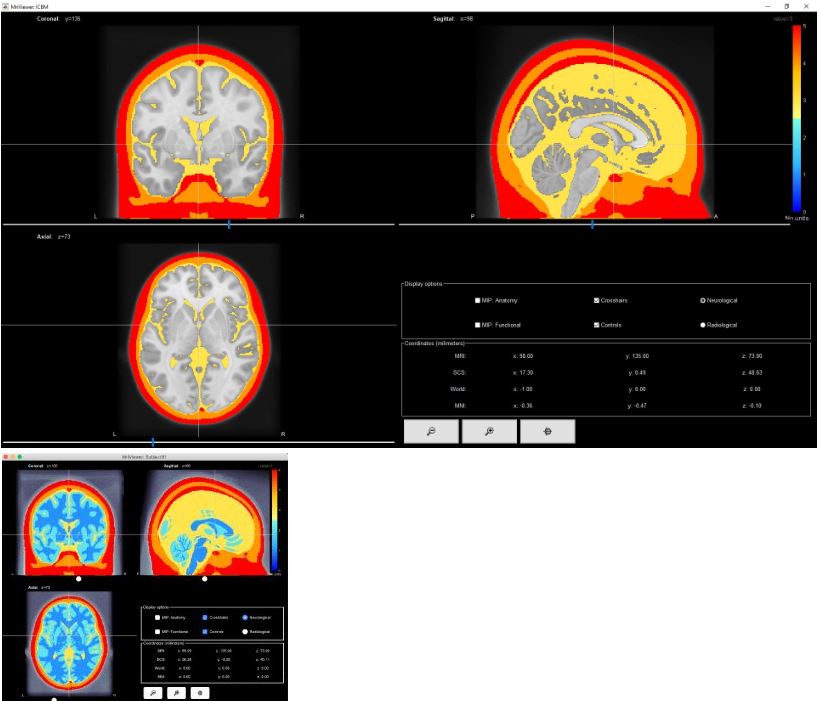
When I compare my results to those of Edouard (from nirstorm), they are close (visually), but mine (GM/WM) do not appear in "blue" based on the colormap I used.
When I select the GM and WM, the values are 2 and 1 respectively, so they must according the the color map legend appear in ligher blue and darker blue.
I tried with the latest version of brainstorm, including latest version of spm/cat12, also trying both on linux and macos (just in case).
I tried for the ICBM template, and also a specific T1 MRI (same issue), different source colormaps ...
Thanks, the amplitude scroll is not enabled when viewing the segmentation, but for now it seems to work (or not bother to much), I was able to go through the rest of the tutorial without any issue, if there is any new issues that might come up later on, I'll let you know.
Indeed, the display of the anatomical parcellations changed quite a lot this year.
The tissue segmentation file is now imported as a "volatlas" file, ie. a labelled volume atlas.
The amplitude slider is not available anymore, but you can increase the transparency if you want to see both the T1 MRI and the labels.